MySQL Master Slave Replication: 7 Easy Steps

1. Setting Up The Master
The first thing you need to accomplish in the MySQL master-slave replication process is to install and configure the master server. If you have not installed MySQL, then you can install MySQL using the following command:

root@repl-master:~# sudo apt-get update
root@repl-master:~# sudo apt-get install mysql-server mysql-client -y
root@repl-master:~# sudo mysql_secure_installation
Read through Installing MySQL on Ubuntu 20.04: 6 Easy Steps for more insights.

Once the MySQL installation process is completed, use the following command to edit the MySQL configuration file:

root@repl-master:~# sudo nano /etc/mysql/mysql.conf.d/mysqld.cnf
Next, in the same file, find the line containing bind-address = 127.0.0.1 and replace that IP address with the IP address of your master replication server. So, the line will look like:
bind-address = 12.34.56.111

Next, find the following lines in the file:

server-id = 1
log_bin = /var/log/mysql/mysql-bin.log
You will see that the above lines have been commented, just uncomment these lines and exit the edit interface by clicking CTRL + X. Save the changes and restart the MySQL service for the changes to take effect.

Restart MySQL service using the following command:

root@repl-master:~# sudo service mysql restart
2. Create A New User For Slave
The next step is to create a new user for your slave server. Use the following command to create it:

root@repl-master:~# mysql -uroot -p;
mysql> CREATE USER ‘slave’@’12.34.56.789‘ IDENTIFIED BY ‘SLAVE_PASSWORD‘;
mysql> GRANT REPLICATION SLAVE ON . TO ‘slave’@’12.34.56.222 ‘;
mysql> FLUSH PRIVILEGES;
mysql> FLUSH TABLES WITH READ LOCK;
You will use the following command to know the current status of the master server:

mysql> SHOW MASTER STATUS;
This command will also tell the slave to follow the master from this position.

3. Move Data From Master To Slave
Now that you have marked the position, you can start moving the data from the master to the slave. You need to create a MySQL dump file to move the data. Use the following command to create the dump file:

root@repl-master:~# mysqldump -u root -p –all-databases –master-data > data.sql
To copy the dump file to the slave, use the following command:

scp data.sql [email protected]
Unlock the tables using the following command:

mysql> UNLOCK TABLES;
4. Configure Slave Server
Now, all you need to do is configure the slave server and test if replication is working. Ensure MySQL is installed.
Open the configuration file in your slave server and update these lines:

root@repl-slave:~# sudo nano /etc/mysql/mysql.conf.d/mysqld.cnf
In the same way that you did for the master server, you need to bind the IP address and uncomment those two lines for the slave server.
Now, restart the MySQL server using the following command:

root@repl-slave:~# sudo service mysql restart
5. Import Data Dump
Use the following command to import the dump file to the slave server:

root@repl-slave:~# mysql -uroot -p < data.sql Once the data is imported, you need to stop MySQL in the slave server using the following command: root@repl-slave:~# mysql -uroot -p; mysql> STOP SLAVE;
You have finally imported the dump files and updated the master IP address, password, log file name, and position, to enable the master to communicate with the slave without any issues.

6. Start Slave Server
Next, use the “Start Slave” command to start operating the slave server.

START SLAVE;
7. Test MySQL Master Slave Replication
To test if your MySQL master slave replication works, just create a database in your master server and see if it is replicated in the slave server. If you can see the database in the slave, then it is working fine.

Create a test database in a master server called ‘sampledb’.

CREATE DATABASE sampledb;
Now login to your slave server and list the databases, and if you see the “sampledb” there, then the master slave replication process is working fine.

Login to your slave server and use the following command to list all databases:

show databases;
Collect and visualize MySQL server logs with the updated MySQL integration for Grafana Cloud

Today, we are excited to announce that the MySQL integration has received an important update, which includes a new pre-built MySQL logs dashboard and the Grafana Agent configuration to view and collect MySQL server logs.

The integration is already available in Grafana Cloud, our platform that brings together all your metrics, logs, and traces with Grafana for full-stack observability.

Why you need logs

Of all the three pillars of observability, metrics are the most widely used: They are easier to gather and store than logs or traces. They are great for detecting problems and understanding system performance at a glance. Still, metrics are often not enough to understand what caused an issue.

On the other hand, logs can tell you many more details about the root cause, once you narrow down the time and location of the problem using metrics.

Getting started with the MySQL integration

Grafana Agent is the universal collector and is all you need to send different telemetry data to the Grafana Cloud stack, including metrics, logs, and traces.

If you already use the embedded Agent integration to collect Prometheus metrics, your Agent configuration could look like this:

yaml

integrations:
  prometheus_remote_write:
    - url: https://<cloud-endpoint>/api/prom/push
  mysqld_exporter:
    enabled: true
    instance: mysql-01
    data_source_name: "root:put-password-here@(localhost:3306)/"

Adding MySQL logs is just adding some extra lines of Grafana Agent config.yml:

yaml

metrics:
  wal_directory: /tmp/wal
logs:
  configs:
  - name: agent
    clients:
    - url: https://<cloud-logs-endpoint>/loki/api/v1/push
    positions:
      filename: /tmp/positions.yaml
    target_config:
      sync_period: 10s
    scrape_configs:
    - job_name: integrations/mysql 
      static_configs:
        - labels:
            instance: mysql-01
            job: integrations/mysql
            __path__: /var/log/mysql/*.log
      pipeline_stages:
        - regex:
            expression: '(?P<timestamp>.+) (?P<thread>[\d]+) \[(?P<label>.+?)\]( \[(?P<err_code>.+?)\] \[(?P<subsystem>.+?)\])? (?P<msg>.+)'
        - labels:
            label:
            err_code:
            subsystem:
        - drop:
            expression: "^ *$"
            drop_counter_reason: "drop empty lines"

integrations:
  prometheus_remote_write:
    - url: https://<cloud-endpoint>/api/prom/push
  mysqld_exporter:
    enabled: true
    instance: mysql-01
    data_source_name: "root:put-password-here@(localhost:3306)/"
    relabel_configs:
      - source_labels: [__address__]
        target_label: job
        replacement: 'integrations/mysql'

The additional configuration above locates and parses MySQL server logs by using an embedded Promtail Agent.

The most crucial configuration part is to make sure that the labels job and instance match each other for logs and metrics. This ensures that we can quickly dive from graphs to corresponding logs for more details on what actually happened.

You can find more information on configuring the MySQL integration in our MySQL integration documentation.

To learn more and get a better understanding of how to correlate metrics, logs, and traces in Grafana, I also recommend checking out the detailed talk by Andrej Ocenas on how to successfully correlate metrics, logs, and traces in Grafana.

Start monitoring with the MySQL logs dashboard

New logs dashboard in the My SQL integration for Grafana Cloud

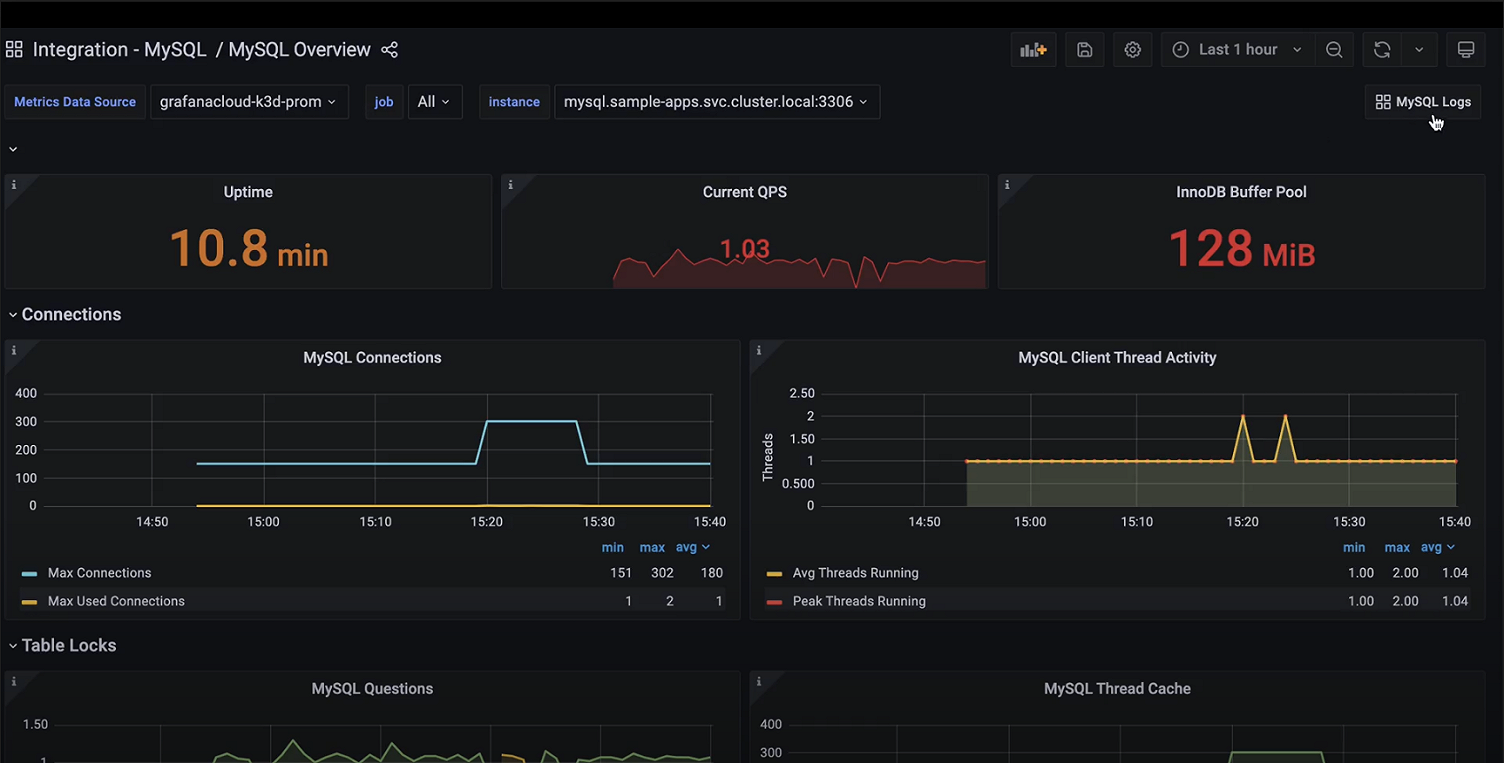
Along with coming packaged with pre-built dashboards as well as metrics and alerts, the MySQL integration for Grafana Cloud now bundles a new MySQL logs dashboard that can be quickly accessed from the MySQL overview dashboard when you need a deeper understanding of what’s going on with your MySQL server:

The important thing to note is that if you jump from one dashboard to another, the context of the MySQL instance and time interval will remain the same.

Try out the MySQL integration

The enhanced MySQL integration with log capabilities is available now for Grafana Cloud users. If you’re not already using Grafana Cloud, we have a generous free forever tier and plans for every use case. Sign up for free now!

It’s the easiest way to get started observing metrics, logs, traces, and dashboards.

For more information on monitoring and alerting on Grafana Cloud and MySQL, check out our MySQL integration documentation,  the MySQL solutions page, or join the #integrations channel in the Grafana Labs Community Slack.