A high availability (HA) architecture using Keepalived and Nginx

Here’s an example configuration for setting up a high availability (HA) architecture using Keepalived and Nginx:

  1. Install Keepalived and Nginx on each server.
  2. Configure Keepalived on both servers:
    • Edit the Keepalived configuration file (e.g., /etc/keepalived/keepalived.conf) on each server.
    • Specify the virtual IP (VIP) address that will be used for HA. For example, set virtual_ipaddress to “192.168.0.100”.
    • Configure the VRRP instance with VRRP authentication and priority settings.
    • Define the health check script to monitor the availability of the main server.
  3. Configure Nginx on each server:
    • Edit the Nginx configuration file (e.g., /etc/nginx/nginx.conf) on each server.
    • Define the upstream servers where the traffic will be load balanced. For example, set upstream backend with the IP addresses and ports of your application servers.
    • Configure the server block to listen on the VIP address and proxy the requests to the upstream servers.
  4. Start and enable Keepalived and Nginx services on both servers.

Once you have configured Keepalived and Nginx on both servers, the primary server will hold the VIP address and handle the incoming traffic. If the primary server becomes unavailable, Keepalived will automatically transfer the VIP to the secondary server, which will take over the traffic handling using Nginx.

Please note that this is a simplified example, and the actual configuration may vary based on your specific requirements and environment. It’s important to refer to the documentation and guides provided by Keepalived and Nginx to ensure a proper configuration for your HA setup.

Here’s a simplified example of a Keepalived configuration file (/etc/keepalived/keepalived.conf):

angelscript

vrrp_instance VI_1 {
    state MASTER  # Set this to BACKUP on the secondary server
    interface eth0  # Specify the network interface to monitor
    virtual_router_id 51  # An arbitrary ID for the VRRP instance
    priority 100  # Set this to a lower value (e.g., 90) on the secondary server

    authentication {
        auth_type PASS
        auth_pass your_password  # Set a strong password for VRRP authentication
    }

    virtual_ipaddress {
        192.168.0.100  # The virtual IP address to be used for HA
    }

    track_script {
        chk_nginx  # Name of the health check script for monitoring Nginx
    }
}

In this example, the primary server is configured as the MASTER with a higher priority, while the secondary server should be configured as BACKUP with a lower priority. The interface parameter specifies the network interface to monitor for connectivity. The virtual_router_id is an arbitrary ID used to identify the VRRP instance.

The authentication section defines the authentication method and password for VRRP. It’s important to set a strong password to ensure secure communication between the servers.

The virtual_ipaddress block specifies the virtual IP address (VIP) to be used for the HA setup. In this case, the VIP is set to 192.168.0.100.

The track_script section allows you to define the health check script (e.g., chk_nginx) that monitors the availability of Nginx.

Please note that this is a simplified example, and you may need to adjust the configuration based on your specific setup, network interface, authentication requirements, and health check script. Make sure to consult the Keepalived documentation and customize the configuration file accordingly.

Here’s a more comprehensive example of a Keepalived configuration file (/etc/keepalived/keepalived.conf) that includes additional directives:

plaintext

! Configuration example for Keepalived

global_defs {
    router_id HA_Cluster  # An arbitrary unique identifier for the router
}

vrrp_script chk_nginx {
    script "/usr/local/bin/check_nginx.sh"  # Path to the custom health check script
    interval 10  # Check interval in seconds
    timeout 3  # Timeout in seconds
    fall 3  # Number of consecutive failures to consider a server as down
    rise 2  # Number of consecutive successes to consider a server as up
}

vrrp_instance VI_1 {
    state MASTER  # Set this to BACKUP on the secondary server
    interface eth0  # Specify the network interface to monitor
    virtual_router_id 51  # An arbitrary ID for the VRRP instance
    priority 100  # Set this to a lower value (e.g., 90) on the secondary server

    authentication {
        auth_type PASS
        auth_pass your_password  # Set a strong password for VRRP authentication
    }

    virtual_ipaddress {
        192.168.0.100  # The virtual IP address to be used for HA
    }

    track_script {
        chk_nginx  # Name of the health check script for monitoring Nginx
    }

    notify_master "/usr/local/bin/master.sh"  # Path to the custom script to execute when becoming the master
    notify_backup "/usr/local/bin/backup.sh"  # Path to the custom script to execute when becoming the backup
    notify_fault "/usr/local/bin/fault.sh"  # Path to the custom script to execute on a fault event

    smtp_alert  # Enable email alerts in case of state transition events
    smtp_server your_smtp_server  # SMTP server address for email alerts
    smtp_connect_timeout 30  # SMTP connection timeout in seconds
    smtp_interface eth0  # Specify the network interface for email alerts
    smtp_from your_email@your_domain.com  # Sender email address for email alerts
    smtp_to your_alert_email@your_domain.com  # Recipient email address for email alerts
    smtp_subject "Keepalived Notification"  # Subject line for email alerts
}

In this example, the global_defs section sets a unique identifier for the router.

The vrrp_script section defines a health check script (chk_nginx) that monitors the availability of Nginx. You can replace /usr/local/bin/check_nginx.sh with the path to your custom health check script. The intervaltimeoutfall, and rise parameters define the check interval, timeout, and criteria for determining the server’s state.

The vrrp_instance section configures the VRRP instance. The state parameter should be set to MASTER on the primary server and BACKUP on the secondary server. The interface parameter specifies the network interface to monitor. The virtual_router_id is an arbitrary ID used to identify the VRRP instance. The priority parameter determines the priority of the server, with a higher value indicating a higher priority.

The authentication section sets the authentication method and password for VRRP communication.

The virtual_ipaddress block specifies the virtual IP address (VIP) to be used for the HA setup.

The track_script section references the health check script to monitor Nginx availability.

The notify_masternotify_backup, and notify_fault directives specify custom scripts to execute on state transition events.

The smtp_alert directive enables email alerts for state transition events. You can configure the SMTP server and email addresses in the subsequent lines.

Please note that this configuration is provided as an example, and you will need to customize it according to your specific setup, file paths, authentication requirements, and notification scripts. Refer to the Keepalived documentation for further details on each directive and adapt the configuration to meet your needs.


Here’s an example of a Keepalived configuration file (/etc/keepalived/keepalived.conf) for the secondary server configured as BACKUP:

plaintext

! Configuration example for Keepalived (BACKUP)

global_defs {
    router_id HA_Cluster  # An arbitrary unique identifier for the router
}

vrrp_script chk_nginx {
    script "/usr/local/bin/check_nginx.sh"  # Path to the custom health check script
    interval 10  # Check interval in seconds
    timeout 3  # Timeout in seconds
    fall 3  # Number of consecutive failures to consider a server as down
    rise 2  # Number of consecutive successes to consider a server as up
}

vrrp_instance VI_1 {
    state BACKUP  # Set this to MASTER on the primary server
    interface eth0  # Specify the network interface to monitor
    virtual_router_id 51  # An arbitrary ID for the VRRP instance
    priority 90  # Set this to a higher value (e.g., 100) on the primary server

    authentication {
        auth_type PASS
        auth_pass your_password  # Set the same strong password used on the primary server
    }

    virtual_ipaddress {
        192.168.0.100  # The virtual IP address to be used for HA
    }

    track_script {
        chk_nginx  # Name of the health check script for monitoring Nginx
    }

    notify_master "/usr/local/bin/master.sh"  # Path to the custom script to execute when becoming the master
    notify_backup "/usr/local/bin/backup.sh"  # Path to the custom script to execute when becoming the backup
    notify_fault "/usr/local/bin/fault.sh"  # Path to the custom script to execute on a fault event

    smtp_alert  # Enable email alerts in case of state transition events
    smtp_server your_smtp_server  # SMTP server address for email alerts
    smtp_connect_timeout 30  # SMTP connection timeout in seconds
    smtp_interface eth0  # Specify the network interface for email alerts
    smtp_from your_email@your_domain.com  # Sender email address for email alerts
    smtp_to your_alert_email@your_domain.com  # Recipient email address for email alerts
    smtp_subject "Keepalived Notification"  # Subject line for email alerts
}

The /usr/local/bin/master.sh script mentioned in the Keepalived configuration file is a custom script that you can create and define according to your specific requirements when the server becomes the master in the high availability setup. This script allows you to perform any necessary actions or configurations when the server transitions to the master state.

Here’s an example of a simple /usr/local/bin/master.sh script:

bash

#!/bin/bash

# This script is executed when the server becomes the master in the high availability setup

# Add your custom actions or configurations here
echo "Server is now the master. Performing custom actions..."
# Example: Start additional services or update configurations

# Restart Nginx to ensure it's using the VIP
systemctl restart nginx

In this example, the script starts by printing a message indicating that the server is now the master and then proceeds to perform any necessary custom actions or configurations. You can add your own logic to the script, such as starting additional services, updating configurations, or performing any other tasks required when the server becomes the master.

In this specific example, the script restarts Nginx to ensure that it is using the virtual IP (VIP) address, which is now assigned to the master server.

Remember to make the script executable by running the following command:

bash

chmod +x /usr/local/bin/master.sh

You can modify the /usr/local/bin/master.sh script according to your specific needs and include any additional commands or configurations that are relevant to your high availability setup.


The /usr/local/bin/check_nginx.sh script mentioned in the Keepalived configuration file is a custom health check script that monitors the availability of Nginx. This script is executed periodically by Keepalived to determine the state of the server and make decisions based on the health check results.

Here’s an example of a simple /usr/local/bin/check_nginx.sh script:

bash

#!/bin/bash

# This script checks the availability of Nginx

# Perform a health check on Nginx
response=$(curl -s -o /dev/null -w "%{http_code}" http://localhost)

# Check the HTTP response code
if [ "$response" = "200" ]; then
    exit 0  # Nginx is healthy, exit with 0 (success)
else
    exit 1  # Nginx is down or not responding properly, exit with 1 (failure)
fi

In this example, the script uses the curl command to send a request to http://localhost and retrieves the HTTP response code. If the response code is 200 (indicating a successful response), the script exits with a status of 0, indicating that Nginx is healthy. Otherwise, if the response code is different from 200, the script exits with a status of 1, indicating that Nginx is down or not responding properly.

You can customize the health check script according to your specific requirements and the way you want to check the health of Nginx. For example, you may want to check additional conditions, such as the response time, specific content on the page, or perform more complex checks. Adapt the script to suit your needs and ensure that it exits with a status of 0 (success) when Nginx is healthy and 1 (failure) when Nginx is down or not responding as expected.

Don’t forget to make the script executable by running the following command:

bash

chmod +x /usr/local/bin/check_nginx.sh

This allows Keepalived to execute the script and perform the health checks at the specified interval in the configuration file.


The /usr/local/bin/backup.sh script mentioned in the Keepalived configuration file is a custom script that you can create and define according to your specific requirements when the server transitions to the backup state in the high availability setup. This script allows you to perform any necessary actions or configurations on the backup server.

Here’s an example of a simple /usr/local/bin/backup.sh script:

bash

#!/bin/bash

# This script is executed when the server becomes the backup in the high availability setup

# Add your custom actions or configurations here
echo "Server is now the backup. Performing custom actions..."
# Example: Stop unnecessary services or disable certain functionalities

# Stop Nginx to prevent conflicts with the master server
systemctl stop nginx

In this example, the script starts by printing a message indicating that the server is now the backup and then proceeds to perform any necessary custom actions or configurations. You can add your own logic to the script, such as stopping unnecessary services, disabling certain functionalities, or performing any other tasks required when the server transitions to the backup state.

In this specific example, the script stops Nginx to prevent conflicts with the master server since the backup server should not be actively serving traffic while in the backup state.

Remember to make the script executable by running the following command:

bash

chmod +x /usr/local/bin/backup.sh

You can modify the /usr/local/bin/backup.sh script according to your specific needs and include any additional commands or configurations that are relevant to your high availability setup.


The /usr/local/bin/fault.sh script mentioned in the Keepalived configuration file is a custom script that you can create and define according to your specific requirements to handle fault events in the high availability setup. This script is executed when a fault event occurs, indicating a problem with the server or the high availability configuration.

Here’s an example of a simple /usr/local/bin/fault.sh script:

bash

#!/bin/bash

# This script is executed on a fault event in the high availability setup

# Add your custom actions or configurations here
echo "Fault event detected. Performing custom actions..."
# Example: Send notifications, log the event, or trigger failover procedures

# Restart Keepalived to initiate failover
systemctl restart keepalived

In this example, the script starts by printing a message indicating that a fault event has been detected and then proceeds to perform any necessary custom actions or configurations. You can add your own logic to the script, such as sending notifications, logging the event, triggering failover procedures, or performing any other tasks required when a fault event occurs.

In this specific example, the script restarts Keepalived to initiate a failover procedure. Restarting Keepalived can help recover from certain types of faults and trigger the transition to a new master server if necessary.

Remember to make the script executable by running the following command:

bash

chmod +x /usr/local/bin/fault.sh

You can modify the /usr/local/bin/fault.sh script according to your specific needs and include any additional commands or configurations that are relevant to handling fault events in your high availability setup.

Collect and visualize MySQL server logs with the updated MySQL integration for Grafana Cloud

Today, we are excited to announce that the MySQL integration has received an important update, which includes a new pre-built MySQL logs dashboard and the Grafana Agent configuration to view and collect MySQL server logs.

The integration is already available in Grafana Cloud, our platform that brings together all your metrics, logs, and traces with Grafana for full-stack observability.

Why you need logs

Of all the three pillars of observability, metrics are the most widely used: They are easier to gather and store than logs or traces. They are great for detecting problems and understanding system performance at a glance. Still, metrics are often not enough to understand what caused an issue.

On the other hand, logs can tell you many more details about the root cause, once you narrow down the time and location of the problem using metrics.

Getting started with the MySQL integration

Grafana Agent is the universal collector and is all you need to send different telemetry data to the Grafana Cloud stack, including metrics, logs, and traces.

If you already use the embedded Agent integration to collect Prometheus metrics, your Agent configuration could look like this:

yaml

integrations:
  prometheus_remote_write:
    - url: https://<cloud-endpoint>/api/prom/push
  mysqld_exporter:
    enabled: true
    instance: mysql-01
    data_source_name: "root:put-password-here@(localhost:3306)/"

Adding MySQL logs is just adding some extra lines of Grafana Agent config.yml:

yaml

metrics:
  wal_directory: /tmp/wal
logs:
  configs:
  - name: agent
    clients:
    - url: https://<cloud-logs-endpoint>/loki/api/v1/push
    positions:
      filename: /tmp/positions.yaml
    target_config:
      sync_period: 10s
    scrape_configs:
    - job_name: integrations/mysql 
      static_configs:
        - labels:
            instance: mysql-01
            job: integrations/mysql
            __path__: /var/log/mysql/*.log
      pipeline_stages:
        - regex:
            expression: '(?P<timestamp>.+) (?P<thread>[\d]+) \[(?P<label>.+?)\]( \[(?P<err_code>.+?)\] \[(?P<subsystem>.+?)\])? (?P<msg>.+)'
        - labels:
            label:
            err_code:
            subsystem:
        - drop:
            expression: "^ *$"
            drop_counter_reason: "drop empty lines"

integrations:
  prometheus_remote_write:
    - url: https://<cloud-endpoint>/api/prom/push
  mysqld_exporter:
    enabled: true
    instance: mysql-01
    data_source_name: "root:put-password-here@(localhost:3306)/"
    relabel_configs:
      - source_labels: [__address__]
        target_label: job
        replacement: 'integrations/mysql'

The additional configuration above locates and parses MySQL server logs by using an embedded Promtail Agent.

The most crucial configuration part is to make sure that the labels job and instance match each other for logs and metrics. This ensures that we can quickly dive from graphs to corresponding logs for more details on what actually happened.

You can find more information on configuring the MySQL integration in our MySQL integration documentation.

To learn more and get a better understanding of how to correlate metrics, logs, and traces in Grafana, I also recommend checking out the detailed talk by Andrej Ocenas on how to successfully correlate metrics, logs, and traces in Grafana.

Start monitoring with the MySQL logs dashboard

New logs dashboard in the My SQL integration for Grafana Cloud

Along with coming packaged with pre-built dashboards as well as metrics and alerts, the MySQL integration for Grafana Cloud now bundles a new MySQL logs dashboard that can be quickly accessed from the MySQL overview dashboard when you need a deeper understanding of what’s going on with your MySQL server:

The important thing to note is that if you jump from one dashboard to another, the context of the MySQL instance and time interval will remain the same.

Try out the MySQL integration

The enhanced MySQL integration with log capabilities is available now for Grafana Cloud users. If you’re not already using Grafana Cloud, we have a generous free forever tier and plans for every use case. Sign up for free now!

It’s the easiest way to get started observing metrics, logs, traces, and dashboards.

For more information on monitoring and alerting on Grafana Cloud and MySQL, check out our MySQL integration documentation,  the MySQL solutions page, or join the #integrations channel in the Grafana Labs Community Slack.

DBeaver Ultimate 22.1 旗舰版激活方法

本站惯例:本文假定你知道DBeaver。不知道可以问问搜索引擎。

DBeaver是一款优秀的数据库管理工具,支持管理众多数据库产品,巴拉巴拉。

DBeaver Ultimate(简称DBeaverUE)支持MongoDBRedisApache Hive等,对比于DBeaver Enterprise多了连接云服务器的功能,但是需要付费使用。

这次要送的这份礼就是: DBeaverUE 22.1.0及以下版本(理论上适用于目前所有新老版本)的破解,可使用它来激活你手头上的DBeaverUE。

下载地址:
百度云下载(download link),提取码:hvx1
OneDrive(download link)

具体使用方法已写在压缩包的README.txt内,有什么问题可以给我提Issue或进QQ群:30347511讨论。

按照README.txt配置好之后,使用DBeaverUE专用激活码:

1
2
3
4
5
aYhAFjjtp3uQZmeLzF3S4H6eTbOgmru0jxYErPCvgmkhkn0D8N2yY6ULK8oT3fnpoEu7GPny7csN
sXL1g+D+8xR++/L8ePsVLUj4du5AMZORr2xGaGKG2rXa3NEoIiEAHSp4a6cQgMMbIspeOy7dYWX6
99Fhtpnu1YBoTmoJPaHBuwHDiOQQk5nXCPflrhA7lldA8TZ3dSUsj4Sr8CqBQeS+2E32xwSniymK
7fKcVX75qnuxhn7vUY7YL2UY7EKeN/AZ+1NIB6umKUODyOAFIc8q6zZT8b9aXqXVzwLJZxHbEgcO
8lsQfyvqUgqD6clzvFry9+JwuQsXN0wW26KDQA==

DBeaverUE有几点需要注意的:

  • windows 系统请使用ZIP包,下载链接:x64
  • mac 系统请使用DMG包,下载链接:intel / m1
  • linux 系统请使用.TAR.GZ包,下载链接:x64
  • DBeaver运行需要java,请自行安装!
  • 不要使用DBeaver自带的jre,它被人为阉割了。

22.1版本请在dbeaver.ini文件末尾添加一行:-Dlm.debug.mode=true

请自行安装jdk11,替换dbeaver.ini内由-vm指定的java路径,把地址换成自己安装的!

如果你的dbeaver.ini内没有-vm参数,请在首行添加你安装jdk的java路径:

1
2
-vm 
/path/to/your/bin/java

下面是国际惯例:

本项目只做个人学习研究之用,不得用于商业用途!

若资金允许,请购买正版,谢谢合作!

Spring Boot Admin的介绍及使用

Spring Boot 有一个非常好用的监控和管理的源软件,这个软件就是 Spring Boot Admin。该软件能够将 Actuator 中的信息进行界面化的展示,也可以监控所有 Spring Boot 应用的健康状况,提供实时警报功能。

主要的功能点有:

  • 显示应用程序的监控状态
  • 应用程序上下线监控
  • 查看 JVM,线程信息
  • 可视化的查看日志以及下载日志文件
  • 动态切换日志级别
  • Http 请求信息跟踪
  • 其他功能点……

可点击 https://github.com/codecentric/spring-boot-admin 更多了解 Spring-boot-admin。

创建Spring Boot Admin项目

创建一个 Spring Boot 项目,用于展示各个服务中的监控信息,加上 Spring Boot Admin 的依赖,具体代码如下所示。

<dependency>
<groupId>org.springframework.boot</groupId>
<artifactId>spring-boot-starter-web</artifactId>
</dependency>
<dependency>
<groupId>de.codecentric</groupId>
<artifactId>spring-boot-admin-starter-server</artifactId>
<version>2.0.2</version>
</dependency>

创建一个启动类,具体代码如下所示。

  1. @EnableAdminServer
  2. @SpringBootApplication
  3. public class App {
  4. public static void main(String[] args) {
  5. SpringApplication.run(App.class, args);
  6. }
  7. }

在属性文件中增加端口配置信息:

server.port=9091

启动程序,访问 Web 地址 http://localhost:9091 就可以看到主页面了,这个时候是没有数据的,如图 1 所示。

Spring Boot Admin主页
图 1  Spring Boot Admin主页

将服务注册到 Spring Boot Admin

创建一个 Spring Boot 项目,名称为 spring-boot-admin-client。添加 Spring Boot Admin Client 的 Maven 依赖,代码如下所示。

<dependency>
<groupId>de.codecentric</groupId>
<artifactId>spring-boot-admin-starter-client</artifactId>
<version>2.0.2</version>
</dependency>

然后在属性文件中添加下面的配置:

server.port=9092
spring.boot.admin.client.url=http://localhost:9091

spring.boot.admin.client.url:Spring Boot Admin 服务端地址。

将服务注册到 Admin 之后我们就可以在 Admin 的 Web 页面中看到我们注册的服务信息了,如图 2 所示。

Spring Boot Admin主页(有数据)
图 2  Spring Boot Admin主页(有数据)

点击实例信息跳转到详细页面,可以查看更多的信息,如图 3 所示。

Spring Boot Admin详情
图 3  Spring Boot Admin详情

可以看到详情页面并没有展示丰富的监控数据,这是因为没有将 spring-boot-admin-client 的端点数据暴露出来。

在 spring-boot-admin-client 中加入 actuator 的 Maven 依赖,代码如下所示。

<dependency>
<groupId>org.springframework.boot</groupId>
<artifactId>spring-boot-starter-actuator</artifactId>
</dependency>

然后在属性文件中追加下面的配置:

management.endpoints.web.exposure.include=*

management.endpoints.web.exposure.include:暴露所有的 actuator 端点信息重启 spring-boot-admin-client,我们就可以在详情页面看到更多的数据,如图 4 所示。

Spring Boot Admin详情(有数据)
图 4  Spring Boot Admin详情(有数据)

监控内容介绍

自定义的 Info 信息、健康状态、元数据,如图 5 所示。

Spring Boot Admin数据展示(一)
图 5  Spring Boot Admin数据展示(一)

CPU、线程等信息如图 6 所示。

Spring Boot Admin数据展示(二)
图 6  Spring Boot Admin数据展示(二)

内存使用情况如图 7 所示。

Spring Boot Admin数据展示(三)
图 7  Spring Boot Admin数据展示(三)

配置信息如图 8 所示。

Spring Boot Admin数据展示(四)
图 8  Spring Boot Admin数据展示(四)

日志级别调整如图 9 所示。

Spring Boot Admin数据展示(五)
图 9  Spring Boot Admin数据展示(五)

Http请求信息如图 10 所示。

Spring Boot Admin数据展示(六)
图 10  Spring Boot Admin数据展示(六)

如何在Admin中查看各个服务的日志

Spring Boot Admin 提供了基于 Web 页面的方式实时查看服务输出的本地日志,前提是服务中配置了 logging.file。

我们在 spring-boot-admin-client 的属性文件中增加下面的内容:

logging.file=/Users/zhangsan/Downloads/spring-boot-admin-client.log

重启服务,就可以在 Admin Server 的 Web 页面中看到新加了一个 Logfile 菜单,如图 11 所示。

Spring Boot Admin日志
图 11  Spring Boot Admin 日志

Docker Dockerfile

什么是 Dockerfile?
Dockerfile 是一个用来构建镜像的文本文件,文本内容包含了一条条构建镜像所需的指令和说明。

使用 Dockerfile 定制镜像
这里仅讲解如何运行 Dockerfile 文件来定制一个镜像,具体 Dockerfile 文件内指令详解,将在下一节中介绍,这里你只要知道构建的流程即可。

1、下面以定制一个 nginx 镜像(构建好的镜像内会有一个 /usr/share/nginx/html/index.html 文件)

在一个空目录下,新建一个名为 Dockerfile 文件,并在文件内添加以下内容:

FROM nginx
RUN echo ‘这是一个本地构建的nginx镜像’ > /usr/share/nginx/html/index.html

2、FROM 和 RUN 指令的作用

FROM:定制的镜像都是基于 FROM 的镜像,这里的 nginx 就是定制需要的基础镜像。后续的操作都是基于 nginx。

RUN:用于执行后面跟着的命令行命令。有以下俩种格式:

shell 格式:

RUN <命令行命令>
# <命令行命令> 等同于,在终端操作的 shell 命令。
exec 格式:

RUN [“可执行文件”, “参数1”, “参数2”]
# 例如:
# RUN [“./test.php”, “dev”, “offline”] 等价于 RUN ./test.php dev offline
注意:Dockerfile 的指令每执行一次都会在 docker 上新建一层。所以过多无意义的层,会造成镜像膨胀过大。例如:

FROM centos
RUN yum -y install wget
RUN wget -O redis.tar.gz “http://download.redis.io/releases/redis-5.0.3.tar.gz”
RUN tar -xvf redis.tar.gz
以上执行会创建 3 层镜像。可简化为以下格式:

FROM centos
RUN yum -y install wget \
&& wget -O redis.tar.gz “http://download.redis.io/releases/redis-5.0.3.tar.gz” \
&& tar -xvf redis.tar.gz
如上,以 && 符号连接命令,这样执行后,只会创建 1 层镜像。

开始构建镜像
在 Dockerfile 文件的存放目录下,执行构建动作。

以下示例,通过目录下的 Dockerfile 构建一个 nginx:v3(镜像名称:镜像标签)。

注:最后的 . 代表本次执行的上下文路径,下一节会介绍。

$ docker build -t nginx:v3 .

以上显示,说明已经构建成功。

上下文路径
上一节中,有提到指令最后一个 . 是上下文路径,那么什么是上下文路径呢?

$ docker build -t nginx:v3 .
上下文路径,是指 docker 在构建镜像,有时候想要使用到本机的文件(比如复制),docker build 命令得知这个路径后,会将路径下的所有内容打包。

解析:由于 docker 的运行模式是 C/S。我们本机是 C,docker 引擎是 S。实际的构建过程是在 docker 引擎下完成的,所以这个时候无法用到我们本机的文件。这就需要把我们本机的指定目录下的文件一起打包提供给 docker 引擎使用。

如果未说明最后一个参数,那么默认上下文路径就是 Dockerfile 所在的位置。

注意:上下文路径下不要放无用的文件,因为会一起打包发送给 docker 引擎,如果文件过多会造成过程缓慢。

指令详解
COPY
复制指令,从上下文目录中复制文件或者目录到容器里指定路径。

格式:

COPY [–chown=:] <源路径1>… <目标路径>
COPY [–chown=:] [“<源路径1>”,… “<目标路径>”]
[–chown=:]:可选参数,用户改变复制到容器内文件的拥有者和属组。

<源路径>:源文件或者源目录,这里可以是通配符表达式,其通配符规则要满足 Go 的 filepath.Match 规则。例如:

COPY hom* /mydir/
COPY hom?.txt /mydir/
<目标路径>:容器内的指定路径,该路径不用事先建好,路径不存在的话,会自动创建。

ADD
ADD 指令和 COPY 的使用格类似(同样需求下,官方推荐使用 COPY)。功能也类似,不同之处如下:

ADD 的优点:在执行 <源文件> 为 tar 压缩文件的话,压缩格式为 gzip, bzip2 以及 xz 的情况下,会自动复制并解压到 <目标路径>。
ADD 的缺点:在不解压的前提下,无法复制 tar 压缩文件。会令镜像构建缓存失效,从而可能会令镜像构建变得比较缓慢。具体是否使用,可以根据是否需要自动解压来决定。
CMD
类似于 RUN 指令,用于运行程序,但二者运行的时间点不同:

CMD 在docker run 时运行。
RUN 是在 docker build。
作用:为启动的容器指定默认要运行的程序,程序运行结束,容器也就结束。CMD 指令指定的程序可被 docker run 命令行参数中指定要运行的程序所覆盖。

注意:如果 Dockerfile 中如果存在多个 CMD 指令,仅最后一个生效。

格式:

CMD
CMD [“<可执行文件或命令>”,””,””,…]
CMD [“”,””,…] # 该写法是为 ENTRYPOINT 指令指定的程序提供默认参数
推荐使用第二种格式,执行过程比较明确。第一种格式实际上在运行的过程中也会自动转换成第二种格式运行,并且默认可执行文件是 sh。

ENTRYPOINT
类似于 CMD 指令,但其不会被 docker run 的命令行参数指定的指令所覆盖,而且这些命令行参数会被当作参数送给 ENTRYPOINT 指令指定的程序。

但是, 如果运行 docker run 时使用了 –entrypoint 选项,将覆盖 ENTRYPOINT 指令指定的程序。

优点:在执行 docker run 的时候可以指定 ENTRYPOINT 运行所需的参数。

注意:如果 Dockerfile 中如果存在多个 ENTRYPOINT 指令,仅最后一个生效。

格式:

ENTRYPOINT [“”,””,””,…]
可以搭配 CMD 命令使用:一般是变参才会使用 CMD ,这里的 CMD 等于是在给 ENTRYPOINT 传参,以下示例会提到。

示例:

假设已通过 Dockerfile 构建了 nginx:test 镜像:

FROM nginx

ENTRYPOINT [“nginx”, “-c”] # 定参
CMD [“/etc/nginx/nginx.conf”] # 变参
1、不传参运行

$ docker run nginx:test
容器内会默认运行以下命令,启动主进程。

nginx -c /etc/nginx/nginx.conf
2、传参运行

$ docker run nginx:test -c /etc/nginx/new.conf
容器内会默认运行以下命令,启动主进程(/etc/nginx/new.conf:假设容器内已有此文件)

nginx -c /etc/nginx/new.conf
ENV
设置环境变量,定义了环境变量,那么在后续的指令中,就可以使用这个环境变量。

格式:

ENV
ENV = =…
以下示例设置 NODE_VERSION = 7.2.0 , 在后续的指令中可以通过 $NODE_VERSION 引用:

ENV NODE_VERSION 7.2.0

RUN curl -SLO “https://nodejs.org/dist/v$NODE_VERSION/node-v$NODE_VERSION-linux-x64.tar.xz” \
&& curl -SLO “https://nodejs.org/dist/v$NODE_VERSION/SHASUMS256.txt.asc”
ARG
构建参数,与 ENV 作用一致。不过作用域不一样。ARG 设置的环境变量仅对 Dockerfile 内有效,也就是说只有 docker build 的过程中有效,构建好的镜像内不存在此环境变量。

构建命令 docker build 中可以用 –build-arg <参数名>=<值> 来覆盖。

格式:

ARG <参数名>[=<默认值>]
VOLUME
定义匿名数据卷。在启动容器时忘记挂载数据卷,会自动挂载到匿名卷。

作用:

避免重要的数据,因容器重启而丢失,这是非常致命的。
避免容器不断变大。
格式:

VOLUME [“<路径1>”, “<路径2>”…]
VOLUME <路径>
在启动容器 docker run 的时候,我们可以通过 -v 参数修改挂载点。

EXPOSE
仅仅只是声明端口。

作用:

帮助镜像使用者理解这个镜像服务的守护端口,以方便配置映射。
在运行时使用随机端口映射时,也就是 docker run -P 时,会自动随机映射 EXPOSE 的端口。
格式:

EXPOSE <端口1> [<端口2>…]
WORKDIR
指定工作目录。用 WORKDIR 指定的工作目录,会在构建镜像的每一层中都存在。(WORKDIR 指定的工作目录,必须是提前创建好的)。

docker build 构建镜像过程中的,每一个 RUN 命令都是新建的一层。只有通过 WORKDIR 创建的目录才会一直存在。

格式:

WORKDIR <工作目录路径>
USER
用于指定执行后续命令的用户和用户组,这边只是切换后续命令执行的用户(用户和用户组必须提前已经存在)。

格式:

USER <用户名>[:<用户组>]
HEALTHCHECK
用于指定某个程序或者指令来监控 docker 容器服务的运行状态。

格式:

HEALTHCHECK [选项] CMD <命令>:设置检查容器健康状况的命令
HEALTHCHECK NONE:如果基础镜像有健康检查指令,使用这行可以屏蔽掉其健康检查指令

HEALTHCHECK [选项] CMD <命令> : 这边 CMD 后面跟随的命令使用,可以参考 CMD 的用法。
ONBUILD
用于延迟构建命令的执行。简单的说,就是 Dockerfile 里用 ONBUILD 指定的命令,在本次构建镜像的过程中不会执行(假设镜像为 test-build)。当有新的 Dockerfile 使用了之前构建的镜像 FROM test-build ,这时执行新镜像的 Dockerfile 构建时候,会执行 test-build 的 Dockerfile 里的 ONBUILD 指定的命令。

格式:

ONBUILD <其它指令>
LABEL
LABEL 指令用来给镜像添加一些元数据(metadata),以键值对的形式,语法格式如下:

LABEL = = = …
比如我们可以添加镜像的作者:

LABEL org.opencontainers.image.authors=”StrongYuen”

penWRT 结合 tinc 组自己的 SDLAN(Step by Step)

本文主要实现在OpenWRT路由器以及不同系统下通过tinc switch mode搭建SDLAN内网服务器方便远程连接,

Switch Mode相对来说配置比较简单,各节点均在同一广播域内,方便调控,tinc节点本身通过DNAT+SNAT可以实现对不同网间端口的调通,

同时Switch Mode中各节点的hosts文件只需保证在公网地址的节点中全部拥有维护即可,其他节点只需维护本节点以及公网节点的hosts文件

下面主要分三步:

(1)公网节点的部署(Master节点)

(2)其他节点的部署(Slave节点)

(3)节点的NAT配置

本次搭建的拓扑以下为例,两个Master节点,若干个Slave节点(以3个不同操作系统的为例)

(0)tinc的安装

各大Linux发行版基本都可以通过包管理对tinc进行安装

sudo yum install tinc
sudo apt install tinc 

OpenWRT也可通过opkg安装tinc

opkg update
opkg install tinc

Windows可在官网下载

Windows中自带的TAP-Windwos版本比较低,建议可以考虑另外安装版本较新的TAP-Windows新建虚拟网卡而不是用tinc-vpn安装包中自带的TAP-Windows

(1)公网节点的部署(Master节点)

需要预先定义定义一个网络名 本次以tincnet为例NETNAME = tincnet

每个节点均需要以以下目录结构创建好配置文件夹

/etc/tinc/tincnet

 % ls -la
total 24
drwxr-xr-x 3 root root 4096 Mar  4 15:07 .
drwxr-xr-x 4 root root 4096 Mar  4 15:06 ..
drwxr-xr-x 2 root root 4096 Mar  4 15:06 hosts
-rwxr-xr-x 1 root root  198 Mar  4 15:06 tinc.conf
-rwxr-xr-x 1 root root   72 Mar  4 15:06 tinc-down
-rwxr-xr-x 1 root root   81 Mar  4 15:06 tinc-up

tinc.conf为tinc的配置文件,tinc-down,tinc-up为启动tinc时执行的脚本,一般用作启动网络,hosts文件夹中存的是各个结点的连接交换信息。

下面先说其中一个节点Linux_Public_Node(2.2.2.2)

各个文件配置情况:

tinc.conf

 % cat tinc.conf 
Name = Linux_Public_Node #此节点名称为Linux_Public_Node
AddressFamily = ipv4 #Internet走IPv4协议
BindToAddress = * 11001 #监听端口
Interface = tinctun0 #tincnet虚拟网卡
Device = /dev/net/tun 
#Mode = <router|switch|hub> (router)
Mode = switch #设置使用Swtich模式 默认为router
ConnectTo = OpenWRT_Public_Node  #连接另一公网Master节点保持双活
Cipher = aes-128-cbc #对称加密算法

tinc-up tinc启动脚本,给对应网卡加IP

 % cat tinc-up
#!/bin/sh
ip link set $INTERFACE up
ip addr add 192.168.212.8/24 dev $INTERFACE

tinc-down tinc停止脚本,关停对应网卡

#!/bin/sh
ip addr del 192.168.212.8/24 dev $INTERFACE
ip link set $INTERFACE down

hosts文件夹 主要保存各节点的交换信息,由于是第一次创建,里面应该是空文件夹,需要先创建一个自己节点的链接信息

 cd hosts
 touch Linux_Public_Node
 % cat Linux_Public_Node 
Address = 2.2.2.2 #公网地址
Subnet = 192.168.212.8/32 #tincnetIP信息
Port = 11001 #公网监听端口

创建完成后通过tincd生成非对称密钥信息

 % sudo tincd -n tincnet -K
Generating 2048 bits keys:
.............+++++ p
........................+++++ q
Done.
Please enter a file to save private RSA key to [/etc/tinc/tincnet/rsa_key.priv]: 
Please enter a file to save public RSA key to [/etc/tinc/tincnet/hosts/Linux_Public_Node]: 

现在tincnet文件夹中会生成私钥,对应的公钥信息会补全到host/Linux_Public_Node中

 % ls /etc/tinc/tincnet                    
hosts  rsa_key.priv  tinc.conf	tinc-down  tinc-up

 % cat /etc/tinc/tincnet/hosts/Linux_Public_Node 
Address = 2.2.2.2 
Subnet = 192.168.212.8/32
Port = 11001
-----BEGIN RSA PUBLIC KEY-----
MIIBCgKCAQEAp7F+8s8lukRv0qaE5hzrQmuy2MPb8hlte/G0pcfnBCVjIL5foJ7P
LZQrTGTsKjRbPzJ9gfZUXiZRkaA+G6Q4DBOVEt41cTceZTgAzL3ief3H6MNXQ0xW
1Wo8kDNlg6g+QJq8iV5j7adJnEPivrDm4CWl8MRmVOckisnQbseKXeuzIYDhpZLA
nlIIGMzhk3OZoPn2xpdMbJqbR0K6SrPvYq7sT3eLn0NVUbyo9D1dmtwtOJy8wmaf
oYdwTvrMdXhNNUmemnswJt8T2j8rAerqnjqz5itN8dk9mZMTKLFZ44CNnJ8jl5pE
ma8lfUnAA/Qq7i9t74pVEvWcLg8HIry16QIDAQAB
-----END RSA PUBLIC KEY-----

至此,节点Linux_Public_Node(2.2.2.2)中的配置已经完成,

下面配置另外一个节点OpenWRT_Public_Node(1.1.1.1)

主要的配置文件生成过程节点Linux_Public_Node类似

生成后如下:

ls -la /etc/tinc/tincnet/
drwxr-xr-x    3 root     root          4096 Mar  4 15:32 .
drwxr-xr-x    4 root     root          4096 Mar  4 15:29 ..
drwxr-xr-x    2 root     root          4096 Mar  4 15:32 hosts
-rw-------    1 root     root          1680 Mar  4 15:32 rsa_key.priv
-rwxr-xr-x    1 root     root            72 Mar  4 15:30 tinc-down
-rwxr-xr-x    1 root     root            80 Mar  4 15:30 tinc-up
-rw-r--r--    1 root     root           218 Mar  4 15:31 tinc.conf

ls -la /etc/tinc/tincnet/hosts
drwxr-xr-x    2 root     root          4096 Mar  4 15:32 .
drwxr-xr-x    3 root     root          4096 Mar  4 15:32 ..
-rw-r--r--    1 root     root           484 Mar  4 15:32 OpenWRT_Public_Node

cat /etc/tinc/tincnet/tinc.conf 
Name = OpenWRT_Public_Node
AddressFamily = ipv4
BindToAddress = * 11001
Interface = tinctun0
Device = /dev/net/tun
#Mode = <router|switch|hub> (router)
Mode = switch
ConnectTo = Linux_Public_Node
Cipher = aes-128-cbc

cat /etc/tinc/tincnet/tinc-up
#!/bin/sh
ip link set $INTERFACE up
ip addr add 192.168.212.6/24 dev $INTERFACE

cat /etc/tinc/tincnet/tinc-down
ip addr del 192.168.212.6/24 dev $INTERFACE
ip link set $INTERFACE down

cat /etc/tinc/tincnet/hosts/OpenWRT_Public_Node 
Address = 1.1.1.1
Subnet = 192.168.212.6/32
Port = 11001
-----BEGIN RSA PUBLIC KEY-----
MIIBCgKCAQEA6Tzot1eXupi+NRCfr29iKbgiXEMW1Ol327WOrAwRtiwGgQIx8LcL
iy9m+sZEWVzlfvhMub6RVM4xlZ39ghYn2OFP4x9K4D6O/HTZHbamuLOEG5zRyVGK
EN+tTStIeEaiHad04QR+6ZFB+UO7WFcBzwVh/rysOL96KaUoU9VeYHVAIkubNsvA
aNSFbmqGYpl5FrXv+sJjMyGRXjc9Lb3q/FWmPApvo/9FTElHx0xH7wvAZnc7mTCH
DB6DN62A1McgydGpn7NLnuFFEeVQf3SI9TqvajcA3vXS8P9RWuRoF5HivZIL5Ebn
FJg0UkyJcWXHUNRczdfTACF6ha0ewk8T9QIDAQAB
-----END RSA PUBLIC KEY-----

OpenWRT下需要再对/etc/config/tinc进行以下修改

cat /etc/config/tinc 
config tinc-net tincnet
	option enabled 1
	option Name OpenWRT_Public_Node

config tinc-host OpenWRT_Public_Node
	option enabled 1
	option net tincnet

下面要做的就是先将两个Master节点的hosts文件夹各自补充对方的节点信息,简单来说就是复制自己那份过去对面,保证两个节点的hosts文件夹都有全部节点的hosts信息

% ls -la /etc/tinc/tincnet/hosts 
total 16
drwxr-xr-x 2 root root 4096 Mar  4 15:37 .
drwxr-xr-x 3 root root 4096 Mar  4 15:25 ..
-rw-r--r-- 1 root root  486 Mar  4 15:25 Linux_Public_Node
-rw-r--r-- 1 root root  485 Mar  4 15:37 OpenWRT_Public_Node

% cat Linux_Public_Node 
Address = 2.2.2.2 
Subnet = 192.168.212.8/32
Port = 11001
-----BEGIN RSA PUBLIC KEY-----
MIIBCgKCAQEAp7F+8s8lukRv0qaE5hzrQmuy2MPb8hlte/G0pcfnBCVjIL5foJ7P
LZQrTGTsKjRbPzJ9gfZUXiZRkaA+G6Q4DBOVEt41cTceZTgAzL3ief3H6MNXQ0xW
1Wo8kDNlg6g+QJq8iV5j7adJnEPivrDm4CWl8MRmVOckisnQbseKXeuzIYDhpZLA
nlIIGMzhk3OZoPn2xpdMbJqbR0K6SrPvYq7sT3eLn0NVUbyo9D1dmtwtOJy8wmaf
oYdwTvrMdXhNNUmemnswJt8T2j8rAerqnjqz5itN8dk9mZMTKLFZ44CNnJ8jl5pE
ma8lfUnAA/Qq7i9t74pVEvWcLg8HIry16QIDAQAB

% cat OpenWRT_Public_Node 
Address = 1.1.1.1
Subnet = 192.168.212.6/32
Port = 11001
-----BEGIN RSA PUBLIC KEY-----
MIIBCgKCAQEA6Tzot1eXupi+NRCfr29iKbgiXEMW1Ol327WOrAwRtiwGgQIx8LcL
iy9m+sZEWVzlfvhMub6RVM4xlZ39ghYn2OFP4x9K4D6O/HTZHbamuLOEG5zRyVGK
EN+tTStIeEaiHad04QR+6ZFB+UO7WFcBzwVh/rysOL96KaUoU9VeYHVAIkubNsvA
aNSFbmqGYpl5FrXv+sJjMyGRXjc9Lb3q/FWmPApvo/9FTElHx0xH7wvAZnc7mTCH
DB6DN62A1McgydGpn7NLnuFFEeVQf3SI9TqvajcA3vXS8P9RWuRoF5HivZIL5Ebn
FJg0UkyJcWXHUNRczdfTACF6ha0ewk8T9QIDAQAB
-----END RSA PUBLIC KEY-----

最后通过systemctl,OpenWRT通过RC启动tinc, 并互ping测试一下

#Linux_Public_Node systemctl
systemctl start tinc@tincnet
#OpenWRT_Public_Node rc
/etc/init.d/tinc start

ping from Linux_Public_Node(192.168.212.8) to OpenWRT_Public_Node(192.168.212.6)

ping from OpenWRT_Public_Node(192.168.212.6) to Linux_Public_Node(192.168.212.8)

(2)其他节点的部署(Slave节点)

Linux系统以节点OpenWRT_Internal_Node(192.168.212.12)为例

同样,先按照之前的文件夹结构创建好对应目录,并复制两个Master节点hosts信息到hosts文件夹,

ls -la /etc/tinc/tincnet/
drwxr-xr-x    3 root     root             0 Mar  4 16:01 .
drwxr-xr-x    4 root     root             0 Mar  4 15:52 ..
drwxr-xr-x    2 root     root             0 Mar  4 16:01 hosts
-rw-------    1 root     root          1676 Mar  4 16:01 rsa_key.priv
-rwxr-xr-x    1 root     root            74 Mar  4 15:58 tinc-down
-rwxr-xr-x    1 root     root            82 Mar  4 15:58 tinc-up
-rw-r--r--    1 root     root           209 Mar  4 16:00 tinc.conf

ls -la /etc/tinc/tincnet/hosts/
drwxr-xr-x    2 root     root             0 Mar  4 16:01 .
drwxr-xr-x    3 root     root             0 Mar  4 16:01 ..
-rw-r--r--    1 root     root             0 Mar  4 15:58 Linux_Public_Node
-rw-r--r--    1 root     root           454 Mar  4 16:01 OpenWRT_Internal_Node
-rw-r--r--    1 root     root             0 Mar  4 15:58 OpenWRT_Public_Node

cat /etc/tinc/tincnet/
hosts/        rsa_key.priv  tinc-down     tinc-up       tinc.conf

cat /etc/tinc/tincnet/tinc.conf 
Name = OpenWRT_Internal_Node 
Interface = tinctun0
Device = /dev/net/tun
#Mode = <router|switch|hub> (router)
Mode = switch
ConnectTo = Linux_Public_Node #此处需要配置链接到两个主节点
ConnectTo = OpenWRT_Public_Node #此处需要配置链接到两个主节点
Cipher = aes-128-cbc

cat /etc/tinc/tincnet/tinc-up
#!/bin/sh
ip link set $INTERFACE up
ip addr add 192.168.212.12/24 dev $INTERFACE

cat /etc/tinc/tincnet/tinc-down
ip addr del 192.168.212.12/24 dev $INTERFACE
ip link set $INTERFACE down

cat /etc/tinc/tincnet/hosts/OpenWRT_Internal_Node 
Subnet = 192.168.212.21/32 #只需要配置Subnet参数

-----BEGIN RSA PUBLIC KEY-----
MIIBCgKCAQEAnU1maDEvbyC2XJLC8aiiwixR+einVu9gyJ4Pi1uhNMSJuVHB0HLQ
s16eOJvoEeJ4q6x0YLwjVJLlcLRW46wUAr1eMLjiovGKcYL8fZCg+Agms3+0y2SM
MaKi5fgBKjXLhdeBx4pvLaBlgYz4BP7pcVLgI0/NHBR6K1PClUtYDN1xCt5SOpiF
XIwyIawwIs6mxLknm7M0a68j7e3ovIsBOW7nLVL0GpLXVJBjAbs5z00uNOVaNJkz
tvttShGgaa+B6o1Xy8gLwB84wKNUXZbmkLobOK7h0qYgEmnQscR8Rhw5G9UJfU8G
8nrPdRRCZnDR5xRpuy0rRJG7gAzpEJ9kHwIDAQAB
-----END RSA PUBLIC KEY-----

#以下为OpenWRT系统需要配置
cat /etc/config/tinc 
config tinc-net tincnet
	option enabled 1
	option Name OpenWRT_Internal_Node

config tinc-host OpenWRT_Internal_Node
	option enabled 1
	option net tincnet

然后需要复制hosts文件夹的本节点信息host\OpenWRT_Internal_Node到Master节点的hosts文件夹中,重启tinc服务即可通,

ping 192.168.212.8
PING 192.168.212.8 (192.168.212.8): 56 data bytes
64 bytes from 192.168.212.8: seq=0 ttl=64 time=25.108 ms
64 bytes from 192.168.212.8: seq=1 ttl=64 time=8.567 ms
64 bytes from 192.168.212.8: seq=2 ttl=64 time=8.891 ms
64 bytes from 192.168.212.8: seq=3 ttl=64 time=8.745 ms
^C
--- 192.168.212.8 ping statistics ---
4 packets transmitted, 4 packets received, 0% packet loss
round-trip min/avg/max = 8.567/12.827/25.108 ms

ping 192.168.212.6
PING 192.168.212.6 (192.168.212.6): 56 data bytes
64 bytes from 192.168.212.6: seq=0 ttl=64 time=7.328 ms
64 bytes from 192.168.212.6: seq=1 ttl=64 time=6.871 ms
64 bytes from 192.168.212.6: seq=2 ttl=64 time=7.205 ms
64 bytes from 192.168.212.6: seq=3 ttl=64 time=7.130 ms
^C
--- 192.168.212.6 ping statistics ---
4 packets transmitted, 4 packets received, 0% packet loss
round-trip min/avg/max = 6.871/7.133/7.328 ms

再配置一个Windows系统的,

首先需要新增一个TAP-Windows的虚拟网卡,以另外安装的新版本TAP-Windows驱动为例,管理员权限运行CMD

C:\Users\k>cd C:\Program Files\TAP-Windows\bin

C:\Program Files\TAP-Windows\bin>.\addtap.bat

C:\Program Files\TAP-Windows\bin>rem Add a new TAP virtual ethernet adapter

C:\Program Files\TAP-Windows\bin>"C:\Program Files\TAP-Windows\bin\tapinstall.exe" install "C:\Program Files\TAP-Windows\driver\OemVista.inf" tap0901
Device node created. Install is complete when drivers are installed...
Updating drivers for tap0901 from C:\Program Files\TAP-Windows\driver\OemVista.inf.
Drivers installed successfully.

C:\Program Files\TAP-Windows\bin>pause
请按任意键继续. . .

到网络连接管理中重命名网卡名称并手动配置IP地址

然后创建好文件目录

C:\Program Files\tinc\tincnet 的目录

2020/03/04  16:14    <DIR>          .
2020/03/04  16:14    <DIR>          ..
2020/03/04  16:16    <DIR>          hosts
2020/03/04  16:17               167 tinc.conf
               1 个文件            167 字节
               3 个目录 144,868,106,240 可用字节
               
C:\Program Files\tinc\tincnet\hosts 的目录

2020/03/04  16:16    <DIR>          .
2020/03/04  16:16    <DIR>          ..
2020/03/04  16:16               499 Linux_Public_Node
2020/03/04  16:16               496 OpenWRT_Public_Node
2020/03/04  16:16                27 Windows_Internal_Node
               3 个文件          1,022 字节
               2 个目录 144,864,964,608 可用字节

C:\Program Files\tinc\tincnet\tinc.conf

Name = Windows_Internal_Node
Interface = tinctun0
#Mode = <router|switch|hub> (router)
Mode = switch
ConnectTo = OpenWRT_Public_Node
ConnectTo = Linux_Public_Node

C:\Program Files\tinc\tincnet\hosts\Windows_Internal_Node

Subnet = 192.168.212.116/32

生成密钥

C:\Program Files\tinc>.\tinc.exe -n tincnet
tinc.tincnet> generate-rsa-keys
Generating 2048 bits keys:
...................................................+++ p
......................+++ q
Done.
Please enter a file to save private RSA key to [C:/Program Files\tinc\tincnet\rsa_key.priv]:
Please enter a file to save public RSA key to [C:/Program Files\tinc\tincnet\hosts\Windows_Internal_Node]:
tinc.tincnet> quit

C:\Program Files\tinc>

然后将带公钥信息的Windows_Internal_Node复制到两个Master节点上面重启节点

通过Windows计算机管理中的服务启动tinc

PING其他Slave节点测试

C:\Program Files\tinc>ping 192.168.212.12

正在 Ping 192.168.212.12 具有 32 字节的数据:
来自 192.168.212.12 的回复: 字节=32 时间=12ms TTL=64
来自 192.168.212.12 的回复: 字节=32 时间=11ms TTL=64
来自 192.168.212.12 的回复: 字节=32 时间=12ms TTL=64
来自 192.168.212.12 的回复: 字节=32 时间=11ms TTL=64

192.168.212.12 的 Ping 统计信息:
    数据包: 已发送 = 4,已接收 = 4,丢失 = 0 (0% 丢失),
往返行程的估计时间(以毫秒为单位):
    最短 = 11ms,最长 = 12ms,平均 = 11ms

如果还有新增节点,那么只需在节点本地创建好配置文件以及hosts信息,然后将本节点的hosts信息复制到Master节点上面即可。

(3)节点的NAT配置

这个是补充内容,比如Slave节点OpenWRT_Internal_Node的br-lan网卡有另一网段192.168.1.0/24的地址192.168.1.1,那么如果我想在Windows_Internal_Node通过OpenWRT_Internal_Node的 tincnet地址192.168.212.12:8080直接访问OpenWRT_Internal_Node 192.168.1.0/24网段中的192.168.1.20:80,那么可以可以通过NAT直接实现。

具体iptables配置如下:

iptables -A input_rule -i tinctun+ -j ACCEPT
iptables -A forwarding_rule -i tinctun+ -j ACCEPT
iptables -A forwarding_rule -o tinctun+ -j ACCEPT
iptables -A output_rule -o tinctun+ -j ACCEPT

iptables -t nat -A PREROUTING -i tinctun0 -p tcp -d 192.168.212.12 --dport 8080 -j DNAT --to-destination 192.168.1.20:80
iptables -t nat -A POSTROUTING -s 192.168.212.0/24 -o br-lan -j SNAT --to 192.168.1.1

refer: https://vnf.cc/2020/03/openwrt-tinc/

automatically connect OpenConnect VPN use a service file

i use a service file

/etc/systemd/system/myVpn.service

[Unit]
Description=My Vpn Connection
After=network.target

[Service]
Type=simple
Environment=password=correcthorsebatterystaple
 ExecStart=/bin/sh -c 'echo YourPasswordHere | sudo openconnect --protocol=nc YourServerHere --user=YourUserHere --passwd-on-stdin'

Restart=always

systemctl enable myVpn

systemctl start myVpn

快速分析 Apache 的 access log,抓出前十大網站流量兇手

說到 Log 分析大家都會先想到用 AWStats 來分析,沒錯這絕對是一個最好的解決方式,但如果你只是要簡單的分析一些資訊,就可以利用一些簡單的 shell 組合來撈出你要的資料


這篇主要是針對 Apache 的 access log 來進行分析,並提供以下範例給大家參考


取得前十名access 最多的IP 位址

cat access_log | awk'{print $ 1}'| sort | uniq -c | sort -nr | head -10


取得前十名 access 最多的網頁

cat access_log | awk'{print $ 11}'| sort | uniq -c | sort -nr | head -10


取得前十名下載流量最大的 zip 檔案

cat access.log | awk'($ 7〜/ \。zip /){print $ 10“” $ 1“” $ 4“” $ 7}'| sort -nr | head -10


取得前十名 Loading 最大的頁面 (大於60秒的 php 頁面)

cat access_log | awk'($ NF> 60 && $ 7〜/ \。php /){print $ 7}'| sort -n | uniq -c | sort -nr | head -10


取得前十名 User access 最久的頁面

cat access_log | awk'($ 7〜/ \。php /){print $ NF“” $ 1“” $ 4“” $ 7}'| sort -nr | head -10


取得access log 平均流量(GB)

cat access_log | awk'{sum + = $ 10} END {print sum / 1024/1024/1024}'


取得所有404 Link

awk'($ 9〜/ 404 /)'access_log | awk'{print $ 9,$ 7}'| 分類


取得所有 access code 的 stats 數量

cat access_log | awk -F'''$ 9 ==“ 400” || $ 9 ==“ 404” || $ 9 ==“ 408” || $ 9 ==“ 499” || $ 9 ==“ 500” || $ 9 ==“ 502” || $ 9 ==“ 504” {print $ 9}'| | 排序| uniq -c | 更多


以上只是簡單分析出常用的需求,也可以自行斟酌調整,然後再從中找到自己想要的分析模式

相信在日常的維護使用中可以幫上很大的忙。


希望是最淺顯易懂的 RxJS 教學

前言

關注 RxJS 已經好一段時間了,最早知道這個東西是因為 redux-observable,是一個 redux 的 middleware,Netflix 利用它來解決複雜的非同步相關問題,那時候我連redux-saga都還沒搞懂,沒想到就又有新的東西出來了。

半年前花了一些時間,找了很多網路上的資料,試圖想要搞懂這整個東西。可是對我來說,很多教學的步調都太快了,不然就是講得太仔細,反而讓初學者無所適從。

這次有機會在公司的新專案裡面嘗試導入redux-observable,身為提倡要導入的人,勢必要對這東西有一定的瞭解。秉持著這個想法,上週認真花了點時間再次把相關資源都研究了一下,漸漸整理出一套「我覺得應該可以把 RxJS 講得更好懂」的方法,在這邊跟大家分享一下。

在開始之前,要先大力稱讚去年 iT 邦幫忙鐵人賽的 Web 組冠軍:30 天精通 RxJS,這系列文章寫得很完整,感受得出來作者下了很多功夫在這上面。看完這篇之後如果對更多應用有興趣的,可以去把這系列的文章讀完。

好,那就讓我們開始吧!

請你先忘掉 RxJS

沒錯,你沒看錯。

要學會 RxJS 的第一件事情就是:忘記它。

忘記有這個東西,完全忘記,先讓我講幾個其他東西,等我們需要講到 RxJS 的時候我會再提醒你的。

在我們談到主角之前,先來做一些有趣的事情吧!

程式基礎能力測試

先讓我們做一個簡單的練習題暖身,題目是這樣的:

有一個陣列,裡面有三種類型的資料:數字、a~z組成的字串、數字組成的字串,請你把每個數字以及數字組成的字串乘以二之後加總
範例輸入:[1, 5, 9, 3, ‘hi’, ‘tb’, 456, ’11’, ‘yoyoyo’]

你看完之後應該會說:「這有什麼難的?」,並且在一分鐘以內就寫出下面的程式碼:

const source = [1, 5, 9, 3, 'hi', 'tb', 456, '11', 'yoyoyo'];
let total = 0;

for (let i = 0; i < source.length; i++) {
  let num = parseInt(source[i], 10);
  if (!isNaN(num)) {
    total += num * 2;
  }
}

相信大家一定都是很直覺的就寫出上面的程式碼,但如果你是個 functional programming 的愛好者,你可能會改用另外一種思路來解決問題:

const source = [1, 5, 9, 3, 'hi', 'tb', 456, '11', 'yoyoyo'];

let total = source
  .map(x => parseInt(x, 10))
  .filter(x => !isNaN(x))
  .map(x => x * 2)
  .reduce((total, value) => total + value )

一開始的例子叫做Imperative(命令式),用陣列搭配一堆函式的例子叫做Declarative(聲明式)。如果你去查了一下定義,應該會看到這兩個的解釋:

Imperative 是命令機器去做事情(how),這樣不管你想要的是什麼(what),都會按照你的命令實現;Declarative 是告訴機器你想要的是什麼(what),讓機器想出如何去做(how)

好,你有看懂上面這些在說什麼嗎?

我是沒有啦。

所以讓我們再看一個例子,其實 Declarative 你已經常常在用了,只是你不知道而已,那就是 SQL:

SELECT * from dogs INNER JOIN owners WHERE dogs.owner_id = owners.id

這句話就是:我要所有狗的資料加上主人的資料。

我只有說「我要」而已,那要怎麼拿到這些資料?我不知道,我也不用知道,都讓 SQL 底層決定怎麼去操作就好。

如果我要自己做出這些資料,在 JavaScript 裡面我必須這樣寫(程式碼取自声明式编程和命令式编程的比较):

//dogs = [{name: 'Fido', owner_id: 1}, {...}, ... ]
//owners = [{id: 1, name: 'Bob'}, {...}, ...]

var dogsWithOwners = []
var dog, owner

for(var di=0; di < dogs.length; di++) {
  dog = dogs[di]
  for(var oi=0; oi < owners.length; oi++) {
    owner = owners[oi]
    if (owner && dog.owner_id == owner.id) {
      dogsWithOwners.push({
        dog: dog,
        owner: owner
      })
    }
  }
}

應該可以大致體驗出兩者的差別吧?後者你必須自己一步步去決定該怎麼做,而前者只是僅僅跟你說:「我想要怎樣的資料」而已。

接著我們再把目光放回到把數字乘以二相加的那個練習。對我來說,最大的不同點是後面那個用陣列搭配函式的例子,他的核心概念是:

把原始資料經過一連串的轉換,變成你想要的資訊

這點超級重要,因為在一開始的例子中,我們是自己一步步去 parse,去檢查去相加,得出數字的總和。而後面的那個例子,他是把原始的資料(陣列),經過一系列的轉換(map, filter, reduce),最後變成了我們想要的答案。

畫成圖的話,應該會長這樣(請原諒我偷懶把乘二的部分拿掉了,但意思不影響):

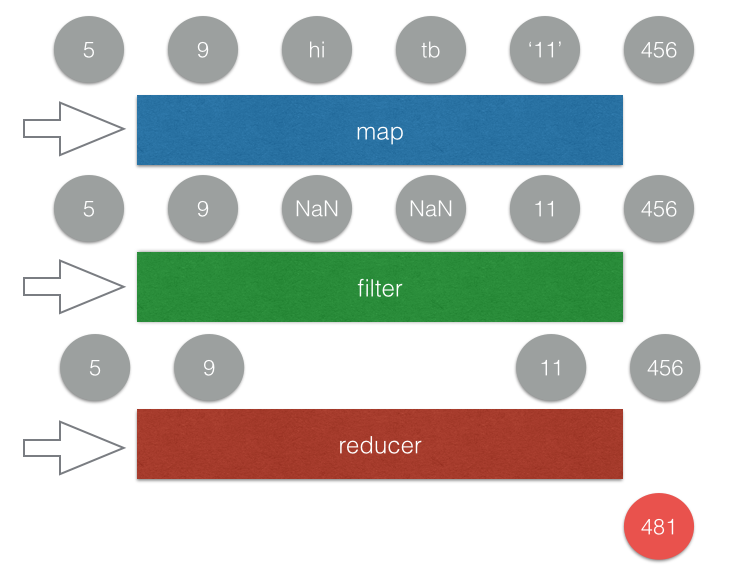
把原始資料經過一連串的轉換,最後變成你想要的答案,這點就是後者最大的不同。只要你有了這個基礎知識之後,再來看 RxJS 就不會覺得太奇怪了。

Reactive Programming

談到 RxJS 的時候,都會談到 Reactive 這個詞,那什麼是 Reactive 呢?可以從英文上的字義來看,這個單字的意思是:「反應、反應性的」,意思就是你要對一些事情做出反應。

所以 Reactive 其實就是在講說:「某些事情發生時,我能夠做出反應」。

讓我們來舉一個大家非常熟知的例子:

window.addEventListener('click', function(){
  console.log('click!');
})

我們加了一個 event listener 在 window 上面,所以我們可以監聽到這個事件,每當使用者點擊的時候就列印出 log。換句話說,這樣就是:「當 window 被點擊時,我可以做出反應」。

正式進入 RxJS

如果你去看 ReactiveX 的網頁,你會發現他有明確的定義 ReactiveX:

ReactiveX is a combination of the best ideas from
the Observer pattern, the Iterator pattern, and functional programming

第一個 Observer pattern 就像是 event listener 那樣,在某些事情發生時,我們可以對其作出反應;第二個 Iterator pattern 我們跳過不講,我認為暫時不影響理解;第三個就像是一開始的例子,我們可以把一個陣列經過多次轉換,轉換成我們想要的資料。

在 Reactive Programming 裡面,最重要的兩個東西叫做 Observable 跟 Observer,其實一開始讓我最困惑的點是因為我英文不好,不知道這兩個到底誰是觀察的誰是被觀察的。

先把它們翻成中文,Observable 就是「可被觀察的」,Observer 就是所謂的「觀察者」。

這是什麼意思呢?就如同上面的例子一樣,當(可被觀察的東西)有事情發生,(Observer,觀察者)就可以做出反應。

直接舉一個例子你就知道了:

Rx.Observable.fromEvent(window, 'click')
  .subscribe(e => {
    console.log('click~');
  })

上面這段程式碼跟我幫 window 加上 event listener 在做的事情完全一樣,只是這邊我們使用了 RxJS 提供的方法叫做fromEvent,來把一個 event 轉成 Observable(可被觀察的),並且在最後加上 subscribe。

這樣寫就代表說我訂閱了這個 Observable,只要有任何事情發生,就會執行我傳進去的 function。

所以到底什麼是 Observable?

Observable 就是一個可被觀察的對象,這個對象可以是任何東西(例如說上述例子就是 window 的 click 事件),當有新資料的時候(例如說新的點擊事件),你就可以接收到這個新資料的資訊並且做出反應。

比起 Observable 這個冷冰冰的說法,我更喜歡的一個說法是 stream,資料流。其實每一個 Observable 就是一個資料流,但什麼是資料流?你就想像成是會一直增加元素的陣列就好了,有新的事件發生就 push 進去。如果你喜歡更專業一點的說法,可以叫它:「時間序列上的一連串資料事件」(取自 Reactive Programming 簡介與教學(以 RxJS 為例)

或是我再舉一個例子,stream 的另外一個解釋就是所謂的「串流影片」,意思就是隨著你不斷播放,就會不斷下載新的片段進來。此時你腦中應該要有個畫面,就是像水流那樣,不斷有新的東西流進來,這個東西就叫做 stream。


(圖片取自 giphy

我理解資料流了,然後呢?

上面有說過,我們可以把任何一個東西轉成 Observable,讓它變成資料流,可是這不就跟 addEventListener 一樣嗎?有什麼特別的?

有,還真的比較特別。

希望你沒有忘記我們剛開始做的那個小練習,就是把一個陣列透過一系列轉換,變成我們要的資料的那個練習。我剛剛有說,你可以把 Observable 想成是「會一直增加元素的陣列」,這代表什麼呢?

代表我們也可以把 Observable 做一系列的轉換!我們也可以用那些用在陣列上的 function!

Rx.Observable.fromEvent(window, 'click')
  .map(e => e.target)
  .subscribe(value => {
    console.log('click: ', value)
  })

我們把 click 事件經過 map 轉換為點擊到的 element,所以當我們最後在 subscribe 的時候,收到的 value 就會是我們點擊的東西。

接著來看一個稍微進階一點的例子:

Rx.Observable.fromEvent(window, 'click')
  .map(e => 1)
  .scan((total, now) => total + now)
  .subscribe(value => {
    document.querySelector('#counter').innerText = value;
  })

首先我們先把每一個 click 事件都透過map轉換成 1(或者你也可以寫成.mapTo(1)),所以每按一次就送出一個數字 1。scan的話其實就是我們一開始對陣列用的reduce,你可以想成是換個名字而已。透過scan加總以後傳給 subscriber,顯示在頁面上面。

就這樣簡單幾行,就完成了一個計算點擊次數的 counter。

可以用一個簡單的 gif 圖來表示上面的範例:

可是 Observable 不只這樣而已,接下來我們要進入到它最厲害的地方了。

威力無窮的組合技

如果把兩個陣列合併,會變成什麼?例如說[1, 2, 3][4, 5, 6]

這要看你指的「合併」是什麼,如果是指串接,那就是[1, 2, 3, 4, 5, 6],如果是指相加,那就是[5, 7, 9]

那如果把兩個 Observable 合併會變成什麼?

Observable 跟陣列的差別就在於多了一個維度:時間。

Observable 是「時間序列上的一連串資料事件」,就像我前面講的一樣,可以看成是一個一直會有新資料進來的陣列。

我們先來看看一張很棒的圖,很清楚地解釋了兩個 Observable 合併會變成什麼:


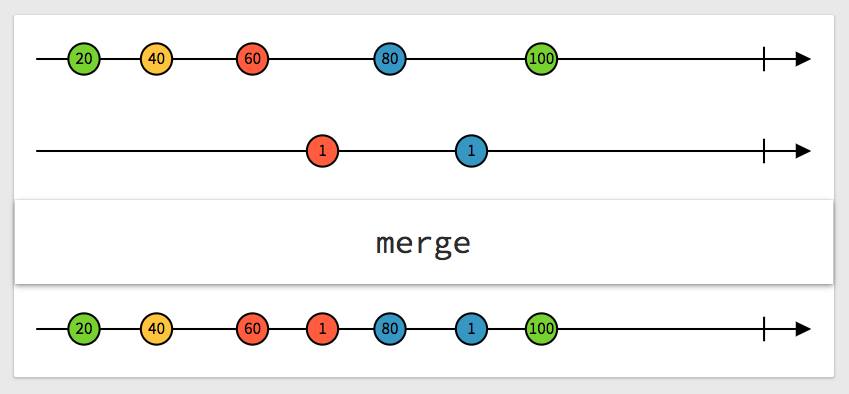
(取自:http://rxmarbles.com/#merge)

上面是一個 Observable,每一個圓點代表一個資料,下面也是一樣,把這兩個合併之後就變成最下面那一條,看圖解應該還滿好懂的,就像是把兩個時間軸合併一樣。

讓我們來看一個可以展現合併強大之處的範例,我們有 +1 跟 -1 兩個按鈕以及文字顯示現在的數字是多少:

該怎麼達成這個功能呢?基本的想法就是我們先把每個 +1 的 click 事件都通過mapTo變成數字 1,取叫 Observable_plus1 好了。再做出一個 Observable_minus1 是把每個 -1 的 click 事件都通過mapTo變成數字 -1。

把這兩個 Observable 合併之後,再利用剛剛提到的scan加總,就是目前應該要顯示的數字了!

Rx.Observable.fromEvent(document.querySelector('input[name=plus]'), 'click')
  .mapTo(1)
  .merge(
    Rx.Observable.fromEvent(document.querySelector('input[name=minus]'), 'click')
      .mapTo(-1)
  )
  .scan((total, now) => total + now)
  .subscribe(value => {
    document.querySelector('#counter').innerText = value;
  })

如果你還是不懂的話,可以參考下面的精美範例,示範這兩個 Observable 是怎麼合在一起的(O代表點擊事件,+1-1則是mapTo之後的結果):

讓我們來比較一下如果不用 Observable 的話,程式碼會長怎樣:

var total = 0;
document.querySelector('input[name=plus]').addEventListener('click', () => {
  total++;
  document.querySelector('#counter').innerText = total;
})

document.querySelector('input[name=minus]').addEventListener('click', () => {
  total--;
  document.querySelector('#counter').innerText = total;
})

有沒有發覺兩者真的差別很大?就如同我之前所說的,是兩種完全不同的思考模式,所以 Reactive Programming 困難的地方不是在於理解,也不是在於語法(這兩者相信你目前都有些概念了),而是在於換一種全新的思考模式。

以上面的寫法來說,就是告訴電腦:「按下加的時候就把一個變數 +1,然後更改文字;按下減的時候就 -1 並且也更改文字」,就可以達成計數器的功能。

以 Reactive 的寫法,就是把按下加當成一個資料流,把按下減也當成一個資料流,再透過各種 function 把這兩個流轉換並且合併起來,讓最後的那個流就是我們想要的結果(計數器)。

你現在應該能體會到我一開始說的了:「把原始資料經過一連串的轉換,最後變成你想要的答案」,這點就是 Reactive Programming 最大的特色。

組合技中的組合技

我們來看一個更複雜一點的範例,是在 canvas 上面實現非常簡單的繪圖功能,就是滑鼠按下去之後可以畫畫,放開來就停止。

要實現這個功能很間單,canvas 提供lineTo(x, y)這個方法,只要在滑鼠移動時不斷呼叫這個方法,就可以不斷畫出圖形來。但有一點要注意的是當你在按下滑鼠時,應該先呼叫moveTo(x, y)把繪圖的點移到指定位置,為什麼呢?

假設我們第一次畫圖是在左上角,第二次按下滑鼠的位置是在右下角,如果沒有先用moveTo移動而是直接用lineTo的話,就會多一條線從左上角延伸到右下角。moveTolineTo的差別就是前者只是移動,後者會跟上次的點連接在一起畫成一條線。

var canvas = document.getElementById('canvas');
var ctx = canvas.getContext('2d');
ctx.beginPath(); // 開始畫畫

function draw(e){
  ctx.lineTo(e.clientX,e.clientY); // 移到滑鼠在的位置
  ctx.stroke(); // 畫畫
}

// 按下去滑鼠才開始偵測 mousemove 事件
canvas.addEventListener('mousedown', function(e){
  ctx.moveTo(e.clientX, e.clientY); // 每次按下的時候必須要先把繪圖的點移到那邊,否則會受上次畫的位置影響
  canvas.addEventListener('mousemove', draw);
})

// 放開滑鼠就停止偵測 
canvas.addEventListener('mouseup', function(e){
  canvas.removeEventListener('mousemove', draw);
})

那如果在 RxJS 裡面,該怎麼實作這個功能呢?

首先憑直覺,應該就是先加上mousedown的事件對吧!至少有個開頭。

Rx.Observable.fromEvent(canvas, 'mousedown')
  .subscribe(e => {
    console.log('mousedown');
  })

可是滑鼠按下去之後應該要變成什麼?這個時候應該要開始監聽mousemove對吧,所以我們這樣寫,用mapTo把每一個mousedown的事件都轉換成mousemove的 Observable:

Rx.Observable.fromEvent(canvas, 'mousedown')
  .mapTo(
    Rx.Observable.fromEvent(canvas, 'mousemove')
  )
  .subscribe(value => {
    console.log('value: ', value);
  })

接著你看一下 console,你會發現每當我點擊的時候,console 就會印出FromEventObservable {_isScalar: false, sourceObj: canvas#canvas, eventName: "mousemove", selector: undefined, options: undefined}

仔細想一下你會發現也滿合理的,因為我用mapTo把每一個滑鼠按下去的事件轉成一個 mousemove 的 Observable,所以用 subscribe 訂閱之後拿到的東西就會是這個 Observable。如果畫成圖,大概長得像這樣:

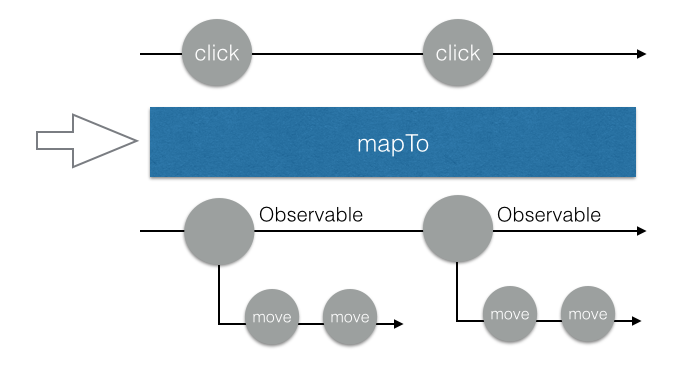
好了,那怎麼辦呢?我想要的其實不是 Observable 本身,而是屬於這個 Observable 裡面的那些東西啊!現在這個情形就是 Observable 裡面又有 Observable,有兩層,可是我想要讓它變成一層就好,該怎麼辦呢?

在此提供一個讓 Observable 變簡單的訣竅:

只要有問題,先想想 Array 就對了!

我前面有提過,可以把 Observable 看成是加上時間維度的進階版陣列,因此只要是陣列有的方法,Observable 通常也都會有。

舉例來說,一個陣列可能長這樣:[1, [2, 2.5], 3, [4, 5]]一共有兩層,第二層也是一個陣列。

如果想讓它變一層的話怎麼辦呢?壓平!

有用過 lodash 或是其他類似的 library 的話,你應該有聽過_.flatten這個方法,可以把這種陣列壓平,變成:[1, 2, 2.5, 3, 4, 5]

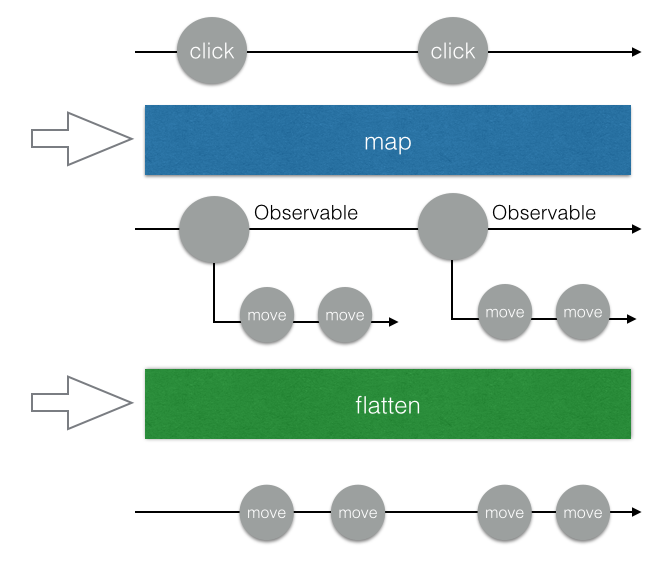
用 flat 這個關鍵字去搜尋 Rx 文件的話,你會找到一個方法叫做 FlatMap,簡單來說就是先map之後再自動幫你壓平。

所以,我們可以把程式碼改成這樣:

Rx.Observable.fromEvent(canvas, 'mousedown')
  .flatMap(e => Rx.Observable.fromEvent(canvas, 'mousemove'))            
  .subscribe(e => {
    console.log(e);
  })

當你點擊之後,會發現隨著滑鼠移動,console 會印出一大堆 log,就代表我們成功了。
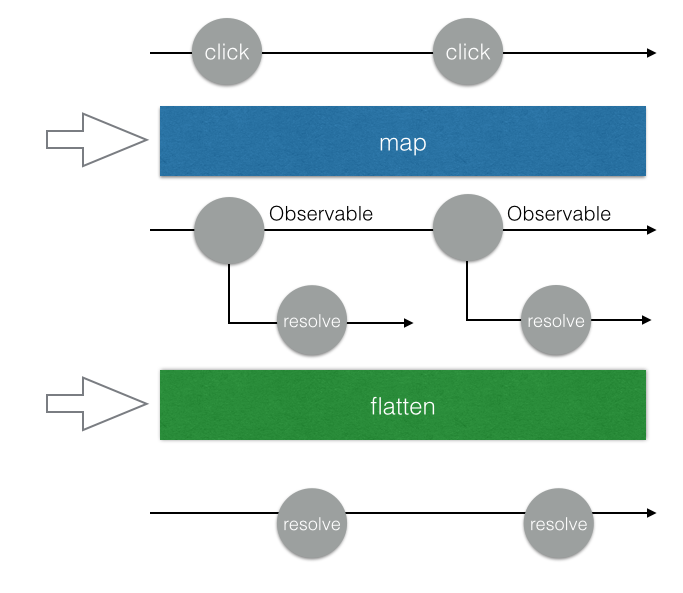
畫成示意圖的話會變成這樣(為了方便說明,我把flatMap在圖片上變成mapflatten兩個步驟):

接下來呢?接下來我們要讓它可以在滑鼠鬆開的時候停止,該怎麼做呢?RxJS 有一個方法叫做takeUntil,意思就是拿到…發生為止,傳進去的參數必須是一個 Observable。

舉例來說,如果寫.takeUntil(window, 'click'),就表示如果任何window的點擊事件發生,這個 Observable 就會立刻終止,不會再送出任何資料。

應用在繪畫的例子上,我們只要把takeUntil後面傳的參數換成滑鼠鬆開就好!順便把subscribe跟畫畫的 function 也一起完成吧!

Rx.Observable.fromEvent(canvas, 'mousedown')
  .flatMap(e => Rx.Observable.fromEvent(canvas, 'mousemove'))
  .takeUntil(Rx.Observable.fromEvent(canvas, 'mouseup'))         
  .subscribe(e => {
    draw(e);
  })

改完之後馬上來實驗一下!滑鼠按下去之後順利開始畫圖,鬆開以後畫圖停止,完美!

咦,可是怎麼按下第二次就沒反應了?我們做出了一個「只能夠成功畫一次圖」的 Observable。

為什麼呢?我們可以先來看一下takeUntil的示意圖(取自:http://rxmarbles.com/#takeUntil)

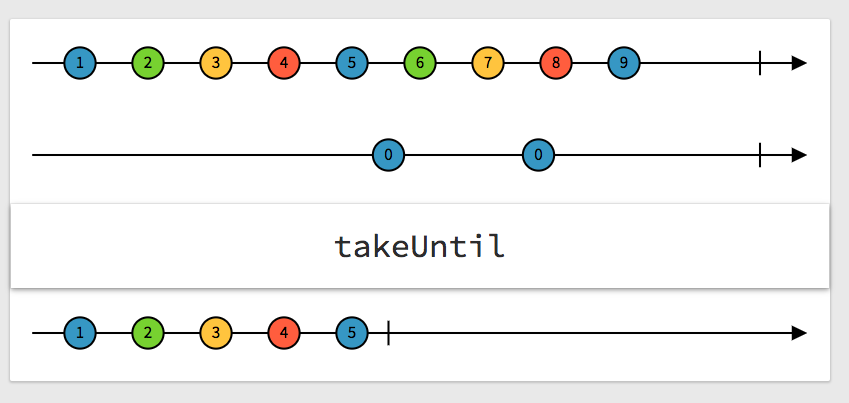
以我們的情形來說,就是只要mouseup事件發生,「整個 Observable」就會停止,所以只有第一次能夠畫圖成功。但我們想要的其實不是這樣,我們想要的是只有mousemove停止而已,而不是整個都停止。

所以,我們應該把takeUntil放在mousemove的後面,也就是:

Rx.Observable.fromEvent(canvas, 'mousedown')
  .flatMap(e => Rx.Observable.fromEvent(canvas, 'mousemove')
      .takeUntil(Rx.Observable.fromEvent(canvas, 'mouseup'))  
  )
  .subscribe(e => {
    draw(e);
  })

這樣子裡面的那個mousemove的 Observable 就會在滑鼠鬆開時停止發送事件,而我們最外層的這個 Observable 監聽的是滑鼠按下,會一直監聽下去。

到這邊其實就差不多了,但還有一個小 bug 要修,就是我們沒有在mousedown的時候利用moveTo移動,造成我們一開始說的那個會把上次畫的跟這次畫的連在一起的問題。

那怎麼辦呢?我已經把mousedown事件轉成其他資料流了,我要怎麼在mousedown的時候做事?

有一個方法叫做do,就是為了這種情形而設立的,使用時機是:「你想做一點事,卻又不想影響資料流」,有點像是能夠針對不同階段 subscribe 的感覺,mousedown的時候 subscribe 一次,最後要畫圖的時候又 subscribe 一次。

Rx.Observable.fromEvent(canvas, 'mousedown')
  .do(e => {
    ctx.moveTo(e.clientX, e.clientY)
  })
  .flatMap(e => Rx.Observable.fromEvent(canvas, 'mousemove')
      .takeUntil(Rx.Observable.fromEvent(canvas, 'mouseup'))  
  )
  .subscribe(e => {
    draw(e);
  })

到這邊,我們就順利完成了畫圖的功能。

如果你想試試看你有沒有搞懂,可以實作看看拖拉移動物體的功能,原理跟這個很類似,都是偵測滑鼠的事件並且做出反應。

喝口水休息一下,下半場要開始了

上半場的目標在於讓你理解什麼是 Rx,並且掌握幾個基本概念:

  1. 一個資料流可以經過一系列轉換,變成另一個資料流
  2. 這些轉換基本上都跟陣列有的差不多,像是mapfilterflatten等等
  3. 你可以合併多個 Observable,也可以把二維的 Observable 壓平

下半場專注的點則是在於實戰應用,並且圍繞著 RxJS 最適合的場景之一:API。

前面我們有提到說可以把 DOM 物件的 event 變成資料流,但除了這個以外,Promise 其實也可以變成資料流。概念其實也很簡單啦,就是 Promise 被 resovle 的時候就發送一個資料,被 reject 的時候就終止。

讓我們來看一個簡單的小範例,每按一次按鈕就會發送一個 request

function sendRequest () {
  return fetch('https://jsonplaceholder.typicode.com/posts/1').then(res => res.json())
}

Rx.Observable.fromEvent(document.querySelector('input[name=send]'), 'click')
  .flatMap(e => Rx.Observable.fromPromise(sendRequest()))
  .subscribe(value => {
    console.log(value)
  })

這邊用flatMap的原因跟剛才的畫圖範例一樣,我們要在按下按鈕時,把原本的資料流轉換成新的資料流,如果只用map的話,會變成一個二維的 Observable,所以必須要用flatten把它壓平。

你可以試試看把flatMap改成map,你最後 subscribe 得到的值就會是一堆 Observable 而不是你想要的資料。

知道怎麼用 Rx 來處理 API 之後,就可以來做一個經典範例了:AutoComplete。

我在做這個範例的時候有極大部分參考30 天精通 RxJS(19): 實務範例 – 簡易 Auto Complete 實作Reactive Programming 簡介與教學(以 RxJS 為例)以及构建流式应用—RxJS详解,再次感謝這三篇文章。

為了要讓大家能夠體會 Reactive Programming 跟一般的有什麼不一樣,我們先用老方法做出這個 Auto Complete 的功能吧!

先來寫一下最底層的兩個函式,負責抓資料的以及 render 建議清單的,我們使用維基百科的 API 來當作範例:

function searchWikipedia (term) {
    return $.ajax({
        url: 'http://en.wikipedia.org/w/api.php',
        dataType: 'jsonp',
        data: {
            action: 'opensearch',
            format: 'json',
            search: term
        }
    }).promise();
}

function renderList (list) {
  $('.auto-complete__list').empty();
  $('.auto-complete__list').append(list.map(item => '<li>' + item + '</li>'))
}

這邊要注意的一個點是維基百科回傳的資料會是一個陣列,格式如下:

[你輸入的關鍵字, 關鍵字清單, 每個關鍵字的介紹, 每個關鍵字的連結]

// 範例:
[
  "dd",
  ["Dd", "DDR3 SDRAM", "DD tank"],
  ["", "Double data rate type three SDRAM (DDR3 SDRAM)", "DD or Duplex Drive tanks"],
  [https://en.wikipedia.org/wiki/Dd", "https://en.wikipedia.org/wiki/DDR3_SDRAM", "...略"]
]

在我們的簡單示範中,只需要取 index 為 1 的那個關鍵字清單就好了。而renderList這個 function 則是傳進一個陣列,就會把陣列內容轉成li顯示出來。

有了這兩個最基礎的 function 之後,就可以很輕易地完成 Auto Complete 的功能:

document.querySelector('.auto-complete input').addEventListener('input', (e) => {
  searchWikipedia(e.target.value).then((data) => {
    renderList(data[1])
  })
})

程式碼應該很好懂,就是每次按下輸入東西的時候去 call api,把回傳的資料餵給renderList去渲染。

最基本的功能完成了,我們要來做一點優化,因為這樣子的實作其實是有一些問題的。

第一個問題,現在只要每打一個字就會送出一個 request,可是這樣做其實有點浪費,因為使用者可能快速的輸入了:java想要找相關的資料,他根本不在乎jjajav這三個 request。

要怎麼做呢?我們就改寫成如果 250ms 裡面沒有再輸入新的東西才發送 request 就好,就可以避免這種多餘的浪費。

這種技巧稱作debounce,實作上也很簡單,就是利用setTimeoutclearTimeout

var timer = null;
document.querySelector('.auto-complete input').addEventListener('input', (e) => {
  if (timer) {
    clearTimeout(timer);
  }
  timer = setTimeout(() => {
    searchWikipedia(e.target.value).then((data) => {
      renderList(data[1])
    })
  }, 250)
})

在 input 事件被觸發之後,我們不直接做事情,而是設置了一個 250ms 過後會觸發的 timer,如果 250ms 內 input 再次被觸發的話,我們就把上次的 timer 清掉,再重新設置一個。

如此一來,就可以保證使用者如果在短時間內不斷輸入文字的話,不會送出相對應的 request,而是會等到最後一個字打完之後的 250 ms 才發出 request。

解決了第一個問題之後,還有一個潛在的問題需要解決。

假設我現在輸入a,接著刪除然後再輸入b,所以第一個 request 會是a的結果,第二個 request 會是b的結果。我們假設 server 出了一點問題,所以第二個的 response 反而比第一個還先到達(可能b的搜尋結果有 cache 但是a沒有),這時候就會先顯示b的內容,等到第一個 response 回來時,再顯示a的內容。

可是這樣 UI 就有問題了,我明明輸入的是b,怎麼 auto complete 的推薦關鍵字是a開頭?

所以我們必須要做個檢查,檢查返回的資料跟我現在輸入的資料是不是一致,如果一致的話才 render:

var timer = null;
document.querySelector('.auto-complete input').addEventListener('input', (e) => {
  if (timer) {
    clearTimeout(timer);
  }
  timer = setTimeout(() => {
    searchWikipedia(e.target.value).then((data) => {
      if (data[0] === document.querySelector('.auto-complete input').value) {
        renderList(data[1])
      }
    })
  }, 250)
})

到這裡應該就差不多了,該有的功能都有了。

接著,讓我們來挑戰用 RxJS 實作吧!

首先,先從簡單版的開始做,就是不包含 debounce 跟上面 API 順序問題的實作,監聽 input 事件轉換成 request,然後用flatMap壓平,其實就跟上面的流程差不多:

Rx.Observable
  .fromEvent(document.querySelector('.auto-complete input'), 'input')
  .map(e => e.target.value)
  .flatMap(value => {
    return Rx.Observable.from(searchWikipedia(value)).map(res => res[1])
  })
  .subscribe(value => {
    renderList(value);
  })

這邊用了兩個map,一個是把e轉成e.target.value,一個是把傳回來的結果轉成res[1],因為我們只需要關鍵字列表,其他的東西其實都不用。

那要如何實作debounce的功能呢?

RxJS 已經幫你實作好了,所以你只要加上.debounceTime(250)就好了,就是這麼簡單。

Rx.Observable
  .fromEvent(document.querySelector('.auto-complete input'), 'input')
  .debounceTime(250)
  .map(e => e.target.value)
  .flatMap(value => {
    return Rx.Observable.from(searchWikipedia(value)).map(res => res[1])
  })
  .subscribe(value => {
    renderList(value);
  })

還有最後一個問題要解決,那就是剛才提到的 request 的順序問題。

Observable 有一個不同的解法,我來解釋給大家聽聽。

其實除了flatMap以外,還有另外一種方式叫做switchMap,他們的差別在於要怎麼把 Observable 給壓平。前者我們之前介紹過了,就是會把每一個二維的 Observable 都壓平,並且「每一個都執行」。

switchMap的差別在於,他永遠只會處理最後一個 Observable。拿我們的例子來說,假設第一個 request 還沒回來的時候,第二個 request 就發出去了,那我們的 Observable 就只會處理第二個 request,而不管第一個。

第一個還是會發送,還是會接收到資料,只是接收到資料以後不會再把這個資料 emit 到 Observable 上面,意思就是根本沒人理這個資料了。

可以看一下簡陋的圖解,flatMap每一個 promise resolve 之後的資料都會被發送到我們的 Observable 上面:

switchMap只會處理最後一個:

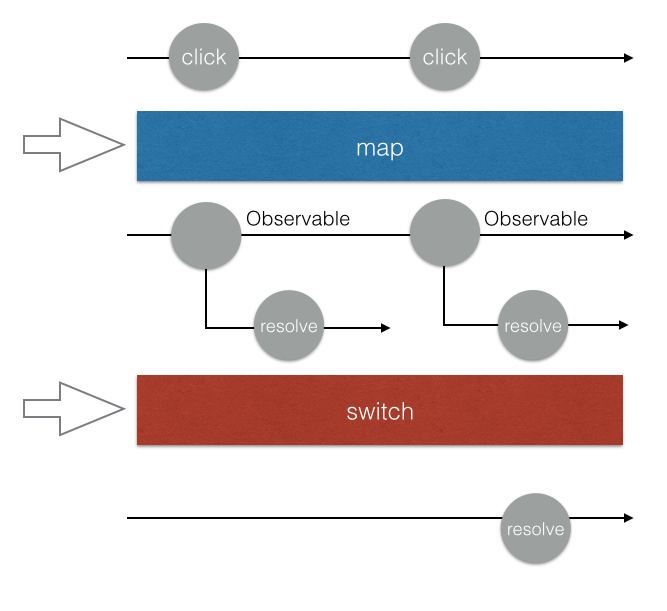
所以我們只要把flatMap改成switchMap,就可以永遠只關注最後一個發送的 request,不用去管 request 傳回來的順序,因為前面的 request 都跟這個 Observable 無關了。

Rx.Observable
  .fromEvent(document.querySelector('.auto-complete input'), 'input')
  .debounceTime(250)
  .map(e => e.target.value)
  .switchMap(value => {
    return Rx.Observable.from(searchWikipedia(value)).map(res => res[1])
  })
  .subscribe(value => {
    renderList(value);
  })

做到這邊,就跟剛剛實作的功能一模一樣了。

但其實還有地方可以改進,我們來做個小小的加強好了。現在的話當我輸入abc,會出現abc的相關關鍵字,接著我把abc全部刪掉,讓 input 變成空白,會發現 API 這時候回傳一個錯誤:The "search" parameter must be set.

因此,我們可以在 input 是空的時候,不發送 request,只回傳一個空陣列,而回傳空陣列這件事情可以用Rx.Observable.of([])來完成,這樣會創造一個會發送空陣列的 Observable:

Rx.Observable
  .fromEvent(document.querySelector('.auto-complete input'), 'input')
  .debounceTime(250)
  .map(e => e.target.value)
  .switchMap(value => {
    return value.length < 1 ? Rx.Observable.of([]) : Rx.Observable.from(searchWikipedia(value)).map(res => res[1])
  })
  .subscribe(value => {
    renderList(value);
  })

還有一個點擊關鍵字清單之後把文字設定成關鍵字的功能,在這邊就不示範給大家看了,但其實就是再創造一個 Observable 去監聽點擊事件,點到的時候就設定文字並且把關鍵字清單給清掉。

我直接附上參考程式碼:

Rx.Observable
  .fromEvent(document.querySelector('.auto-complete__list'), 'click')
  .filter(e => e.target.matches('li'))
  .map(e => e.target.innerHTML)
  .subscribe(value => {
    document.querySelector('.auto-complete input').value = value;
    renderList([])
  })

雖然我只介紹了最基本的操作,但 RxJS 的強大之處就在於除了這些,你甚至還有retry可以用,只要輕鬆加上這個,就能夠有自動重試的功能。

相關的應用場景還有很多,只要是跟 API 有關連的幾乎都可以用 RxJS 很優雅的解決。

React + Redux 的非同步解決方案:redux-observable

這是我們今天的最後一個主題了,也是我開場所提到的。

React + Redux 這一套非常常見的組合,一直都有一個問題存在,那就是沒有規範非同步行為(例如說 API)到底應該怎麼處理。而開源社群也有許多不同的解決方案,例如說 redux-thunk、redux-promise、redux-saga 等等。

我們前面講了這麼多東西,舉了這麼多範例,就是要證明給大家看 Reactive programming 很適合拿來解決複雜的非同步問題。因此,Netflix 就開源了這套redux-observable,用 RxJS 來處理非同步行為。

在瞭解 RxJS 之後,可以很輕鬆的理解redux-observable的原理。

在 redux 的應用裡面,所有的 action 都會通過 middleware,你可以在這邊對 action 做任何處理。或者我們也可以把 action 看做是一個 Observable,例如說:

// 範例而已
Rx.Observable.from(actionStreams)
  .subscribe(action => {
    console.log(action.type, action.payload)
  })

有了這個以後,我們就可以做一些很有趣的事情,例如說偵測到某個 action 的時候,我們就發送 request,並且把 response 放進另外一個 action 裡面送出去。

Rx.Observable.from(actionStreams)
  .filter(action => action.type === 'GET_USER_INFO')
  .switchMap(
    action => Rx.Observable.from(API.getUserInfo(action.payload.userId))
  )
  .subscribe(userInfo => {
    dispatch({
      type: 'SET_USER_INFO',
      payload: userInfo
    })
  })

上面就是一個簡單的例子,但其實redux-observable已經幫我們處理掉很多東西了,所以我們只要記得一個概念:

action in, action out

redux-observable 是一個 middleware,你可以在裡面加上很多epic,每一個epic就是一個 Observable,你可以監聽某一個指定的 action,做一些處理,再轉成另外一個 action。

直接看程式碼會比較好懂:

import Actions from './actions/user';
import ActionTypes from './actionTypes/user'

const getUserEpic = action$ =>
  action$.ofType(actionTypes.GET_USER)
    .switchMap(
      action => Rx.Observable.from(API.getUserInfo(action.payload.userId))
    ).map(userInfo => Actions.setUsers(userInfo))

大概就是像這樣,我們監聽一個 action type(GET_USER),一接收到的時候就發送 request,並且把結果轉為setUsers這個 action,這就是所謂的 action in, action out。

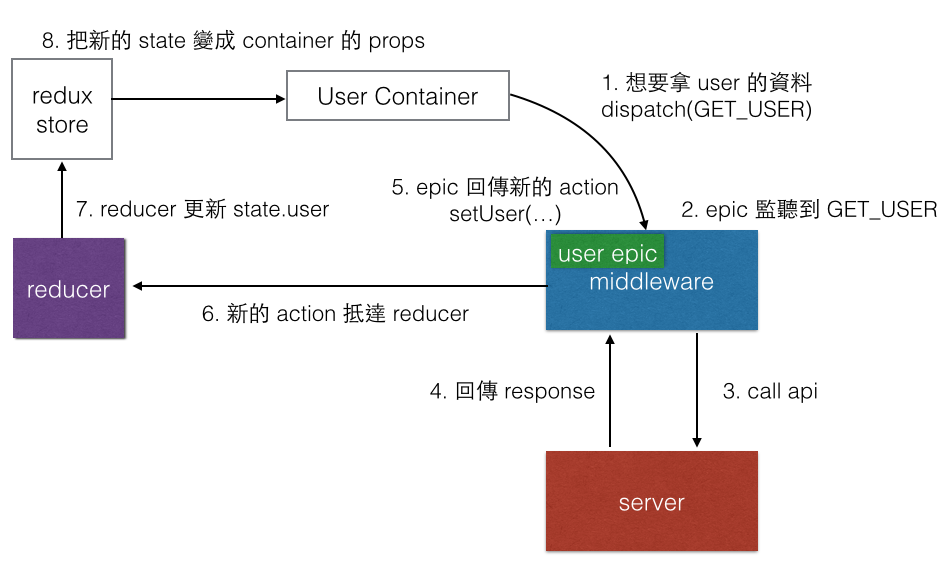
這樣的好處是什麼?好處是明確制定了一個規範,當你的 component 需要資料的時候,就送出一個 get 的 action,這個 action 經過 middleware 的時候會觸發 epic,epic 發 request 給 server 拿資料,轉成另外一個 set 的 action,經過 reducer 設定資料以後更新到 component 的 props。

可以看這張流程圖:

總之呢,epic就是一個 Observable,你只要確保你最後回傳的東西是一個 action 就好,那個 action 就會被送到 reducer 去。

礙於篇幅的關係,今天對於redux-observable只是概念性的帶過去而已,沒有時間好好示範,之後再來找個時間好好寫一下redux-observable的實戰應用。

結論

從一開始的陣列講到 Observable,講到畫圖的範例再講到經典的 Auto Complete,最後還講了redux-observable,這一路的過程中,希望大家有體會到 Observable 在處理非同步行為的強大之處以及簡潔。

這篇的目的是希望能讓大家理解 Observable 大概在做什麼,以及介紹一些簡單的應用場景,希望能提供一篇簡單易懂的中文入門文章,讓更多人能體會到 Observable 的威力。

喜歡這篇的話可以幫忙分享出去,發現哪邊有寫錯也歡迎留言指正,感謝。

參考資料:

30 天精通 RxJS (01):認識 RxJS
Reactive Programming 簡介與教學(以 RxJS 為例)
The introduction to Reactive Programming you’ve been missing
构建流式应用—RxJS详解
Epic Middleware in Redux
Combining multiple Http streams with RxJS Observables in Angular2

影片:
Netflix JavaScript Talks – RxJS + Redux + React = Amazing!
RxJS Quick Start with Practical Examples
RxJS Observables Crash Course
Netflix JavaScript Talks – RxJS Version 5
RxJS 5 Thinking Reactively | Ben Lesh

一次搞懂OAuth與SSO在幹什麼?

一次搞懂OAuth與SSO在幹什麼?

最近的Line Notify、Line Login,以及前一陣子的Microsoft Graph API,全都使用到了OAuth作為用戶身分驗證以及資源存取的基礎。但很多讀者會卡在OAuth的運作流程上,根本的原因是不理解OAuth到底是幹嘛的?其存在的目的為何?以及如何應用?

因此,我想花一個篇幅,盡可能短的介紹一下OAuth與SSO,但,與坊間文章不同的是,我希望從應用情境的角度(而非技術)切入談這件事情,冀望能夠讓開發人員對OAuth有個最基本的認識。

OAuth的背景

我們回頭看Line Login與Line Notify中的例子,OAuth在這邊最簡單的應用情境,就是身分驗證。典型的情境中有幾個角色,分別是:

  1. 網站或App的開發單位 : 也就是各位開發人員
  2. OAuth服務的提供者(Provider) : 也就是Line(或Google、Microsoft…etc.)
  3. 終端用戶(End-User) : 網站使用者、Line使用者、消費者、客戶…etc.

上面這三者的關係是什麼?

當我們建立一個網站(例如Pc Home購物)、或App(例如一個手機遊戲),都非常有可能需要建立一組會員機制,這些機制包含:

  1. 登入(包含身分驗證,帳號、密碼保存…等)
  2. 個資管理(用戶名稱、地址、電話、暱稱、手機…等)

以往,幾乎都是每一個網站自己做一套,但這樣有很多麻煩事,首先用戶要記得很多組帳號密碼,而每一個網站都自己搞一套會員機制,網站開發人員自己也很辛苦,加上最近這幾年大家都很重視個資,網站儲存(保管)了很多帳號密碼與個人資料,總是會有被駭的風險。因此,這十年來,很多大廠開始提供登入(與身分驗證)機制服務。

也就是說,小網站你不用自己做登入和會員管理了,你連過來我這邊,我是大網站,我已經有幾百萬上億的用戶,(例如全台灣都用Line),而且早就做了超級安全的會員管理機制,你這小網站何必自己做會員管理呢?你跟我連結不就得了,我大網站來幫你管理個資,提供你登入的服務,你把會員資料通通存我這裡,用戶也不需要記得很多組帳密,只需要記得我大網站的帳密,一樣可以登入你小網站(或稱為第三方應用)來使用你提供的服務,這樣皆大歡喜。

因此,大家就這麼做了。

但提供這樣服務的大廠越來越多,Google、Microsoft、Yahoo…都提供了這樣的服務,導致小網站為了對使用者更貼心,可能要同時連結上很多這種提供身分服務的大網站,如果每一家連結方式都不同,就很煩。因此,業界就開了幾個會,共同決定了一套工業標準,就是OAuth了。

有哪些功能?

所以你會發現,基本上網站開發人員有兩種身分,一種是OAuth服務的提供者(像是Google、微軟、Line),另一種是OAuth服務的使用者,像是一般的小網站(trello)。而終端用戶只需要在大網站申請過帳號,就可以登入小網站來使用服務。

但,大網站當然不能給你(小網站)用戶的帳號和密碼,否則多麼不安全呢?因此OAuth工業標準讓服務提供者(大網站)透過一種標準的作法,在用戶驗證過身分之後,提供一組會過期的令牌給小網站,這就是token。

小網站拿著這個令牌,就可以跟大網站取得用戶的個資,或是其他需要的資料。小網站也可以拿著這個令牌,跟大網站確認該令牌是否已經到期。

所以,整個流程大概是底下這樣:

由於上述過程中的(2),登入畫面是大網站提供的,因此你小網站不會得知用戶的帳號密碼,大網站只會在登入成功後,把一個具有有效期限的Token傳給你小網站,一旦你需要存取用戶的資料,就拿這個token去跟大網站溝通。

當然,實際上的OAuth操作步驟又更複雜,如果你參考我們前面介紹的Line Login那篇,就會知道,用戶被引導到大網站完成登入之後,你小網站是無法直接取得token的,而是取得一個code,再去用這個code跟大網站換得一個token。為何要多這一道手續?因為,網際網路是個不安全的所在,在網路上傳遞的任何東西,都可能被路上經手的路由器或其他設備給擷取、偽造、變更,因此要確保安全,得更加小心一點。

因此一般的OAuth流程,其實應該長得像是底下這樣(這是微軟Graph API的OAuth Auth Authorization Code Flow流程) :

還有更複雜的、更進階的。

如果大網站除了提供用戶的個資之外,還要可以讓小網站有權限做一些額外的事情,像是變更用戶大頭照、取得用戶上傳的檔案、幫用戶book一個行事曆…這都是Office 365/Google Apps裡面典型的情境,如此一來,終端使用者(end-user)可能就要授權小網站,到底能夠使用該用戶在大網站中多少資料,也就是大網站的用戶要賦予小網站多大的權限,來存取該終端用戶的個資? 這部分,一般稱之為 Permission Scope。

所以,OAuth除了提供登入身分驗證之外,也逐漸開始負擔了網站合作之間的授權管理功能。

好,現在回過頭來看,請參考Line Login與Line Notify這兩篇中的例子,你會發現一開始我們都只是組出一個URL,來取得Authorization Code,這一段取得的code是明碼,走的是http get,透過瀏覽器網址列來傳遞,所以在網際網路上是可以被任何人擷取看到的(因此你當然應該加上SSL),但你會發現接下來小網站取得Authorization Code之後,要透過http post,從後端走另一個路徑去跟大網站換得token,這一段並不是走瀏覽器http get,而是在小網站的伺服器端走另一個https路徑,去跟大網站溝通。由於這一段往往是在背後做的(伺服器端對伺服器端,不會經過用戶端),因此安全性相對高(OAuth也有實作成在前端取token的implicit flow,但走後端相對安全點)。如果從後端換取Token,不管是瀏覽器或用戶本身都無法得知token,就算你的用戶被人在瀏覽器或電腦中安裝了木馬也無法得知,再加上Token還有期限,因此相對安全。

這也是我們前面說的,實務上小網站被導引到大網站完成登入之後,並非直接取得token而是取得一個Authorization Code的原因。

所以你也不難理解,既然Token會到期,就衍生出需要更新(refresh)token、判斷token的有效性、設定Token的生命長度…等相關議題,但在這邊就先不介紹了。

更進一步實現SSO

好的,假設網路世界的身分驗證,都是某一個大網站(例如Google)提供的,而其他服務的小網站(網站A、網站B、網站C…),都使用Google提供的身分驗證服務,那這世界就很單純了,一旦用戶登入了網站B,用著用著,連結到了網站A,還需要重新登入一次嗎? 不需要,因為在網站B已經登入過了,這就是SSO(Single Sign On)在internet上的實現。

一旦OAuth提供者和使用者(也就是大小網站),都有實作這樣的功能,那用戶翱翔於網際網路上時,就只需要記得一組帳號密碼了,這世界多麼美好…

當然,現實世界不是這樣的,你想想,當個大網站將會擁有所有人的個資耶,這意味著什麼呢? 不用大腦想也知道。 所以,只有你想做大網站? 不,每個人都想做。因此只要稍具規模網際網路服務提供者,都希望自己是最大的那個身分驗證提供者。

現在、連Line這個IM界的新玩家(相對What’s app、skype來說,真的算是新的),挾著在亞洲(其實也只有台灣、日本、和韓國…)的超人氣,都開始提供OAuth Provider服務了,你說,Line這家公司它還不夠任性嗎?
#搞懂了OAuth和SSO,不妨接著玩玩Line NotifyLine Login,很好玩唷… Smile