( ! ) Deprecated: Function WP_Dependencies-&gt;add_data() was called with an argument that is <strong>deprecated</strong> since version 6.9.0! IE conditional comments are ignored by all supported browsers. in /var/www/html/wp-includes/functions.php on line 6131
Call Stack
#TimeMemoryFunctionLocation
10.0001484048{main}( ).../index.php:0
20.0006484400require( '/var/www/html/wp-blog-header.php ).../index.php:17
30.31974102352require_once( '/var/www/html/wp-includes/template-loader.php ).../wp-blog-header.php:19
40.32484131344include( '/var/www/html/wp-content/themes/twentyfifteen/single.php ).../template-loader.php:125
50.32484131344get_header( $name = ???, $args = ??? ).../single.php:10
60.32484131560locate_template( $template_names = [0 => 'header.php'], $load = TRUE, $load_once = TRUE, $args = [] ).../general-template.php:48
70.32484131656load_template( $_template_file = '/var/www/html/wp-content/themes/twentyfifteen/header.php', $load_once = TRUE, $args = [] ).../template.php:749
80.32514132200require_once( '/var/www/html/wp-content/themes/twentyfifteen/header.php ).../template.php:814
90.32534139608wp_head( ).../header.php:18
100.32534139608do_action( $hook_name = 'wp_head' ).../general-template.php:3197
110.32534139824WP_Hook->do_action( $args = [0 => ''] ).../plugin.php:522
120.32534139824WP_Hook->apply_filters( $value = '', $args = [0 => ''] ).../class-wp-hook.php:365
130.32544143240wp_enqueue_scripts( '' ).../class-wp-hook.php:341
140.32544143240do_action( $hook_name = 'wp_enqueue_scripts' ).../script-loader.php:2311
150.32544143456WP_Hook->do_action( $args = [0 => ''] ).../plugin.php:522
160.32544143456WP_Hook->apply_filters( $value = '', $args = [0 => ''] ).../class-wp-hook.php:365
170.32564145344twentyfifteen_scripts( '' ).../class-wp-hook.php:341
180.32574146864wp_style_add_data( $handle = 'twentyfifteen-ie', $key = 'conditional', $value = 'lt IE 9' ).../functions.php:440
190.32574146864WP_Styles->add_data( $handle = 'twentyfifteen-ie', $key = 'conditional', $value = 'lt IE 9' ).../functions.wp-styles.php:245
200.32574146864WP_Dependencies->add_data( $handle = 'twentyfifteen-ie', $key = 'conditional', $value = 'lt IE 9' ).../class-wp-styles.php:385
210.32574146864_deprecated_argument( $function_name = 'WP_Dependencies->add_data()', $version = '6.9.0', $message = 'IE conditional comments are ignored by all supported browsers.' ).../class-wp-dependencies.php:317
220.32574152816wp_trigger_error( $function_name = '', $message = 'Function WP_Dependencies->add_data() was called with an argument that is <strong>deprecated</strong> since version 6.9.0! IE conditional comments are ignored by all supported browsers.', $error_level = 16384 ).../functions.php:5925
230.32584272352trigger_error( $message = 'Function WP_Dependencies-&gt;add_data() was called with an argument that is <strong>deprecated</strong> since version 6.9.0! IE conditional comments are ignored by all supported browsers.', $error_level = 16384 ).../functions.php:6131

( ! ) Deprecated: Function WP_Dependencies-&gt;add_data() was called with an argument that is <strong>deprecated</strong> since version 6.9.0! IE conditional comments are ignored by all supported browsers. in /var/www/html/wp-includes/functions.php on line 6131
Call Stack
#TimeMemoryFunctionLocation
10.0001484048{main}( ).../index.php:0
20.0006484400require( '/var/www/html/wp-blog-header.php ).../index.php:17
30.31974102352require_once( '/var/www/html/wp-includes/template-loader.php ).../wp-blog-header.php:19
40.32484131344include( '/var/www/html/wp-content/themes/twentyfifteen/single.php ).../template-loader.php:125
50.32484131344get_header( $name = ???, $args = ??? ).../single.php:10
60.32484131560locate_template( $template_names = [0 => 'header.php'], $load = TRUE, $load_once = TRUE, $args = [] ).../general-template.php:48
70.32484131656load_template( $_template_file = '/var/www/html/wp-content/themes/twentyfifteen/header.php', $load_once = TRUE, $args = [] ).../template.php:749
80.32514132200require_once( '/var/www/html/wp-content/themes/twentyfifteen/header.php ).../template.php:814
90.32534139608wp_head( ).../header.php:18
100.32534139608do_action( $hook_name = 'wp_head' ).../general-template.php:3197
110.32534139824WP_Hook->do_action( $args = [0 => ''] ).../plugin.php:522
120.32534139824WP_Hook->apply_filters( $value = '', $args = [0 => ''] ).../class-wp-hook.php:365
130.32544143240wp_enqueue_scripts( '' ).../class-wp-hook.php:341
140.32544143240do_action( $hook_name = 'wp_enqueue_scripts' ).../script-loader.php:2311
150.32544143456WP_Hook->do_action( $args = [0 => ''] ).../plugin.php:522
160.32544143456WP_Hook->apply_filters( $value = '', $args = [0 => ''] ).../class-wp-hook.php:365
170.32564145344twentyfifteen_scripts( '' ).../class-wp-hook.php:341
180.36474273456wp_style_add_data( $handle = 'twentyfifteen-ie7', $key = 'conditional', $value = 'lt IE 8' ).../functions.php:444
190.36474273456WP_Styles->add_data( $handle = 'twentyfifteen-ie7', $key = 'conditional', $value = 'lt IE 8' ).../functions.wp-styles.php:245
200.36474273456WP_Dependencies->add_data( $handle = 'twentyfifteen-ie7', $key = 'conditional', $value = 'lt IE 8' ).../class-wp-styles.php:385
210.36474273456_deprecated_argument( $function_name = 'WP_Dependencies->add_data()', $version = '6.9.0', $message = 'IE conditional comments are ignored by all supported browsers.' ).../class-wp-dependencies.php:317
220.36474273776wp_trigger_error( $function_name = '', $message = 'Function WP_Dependencies->add_data() was called with an argument that is <strong>deprecated</strong> since version 6.9.0! IE conditional comments are ignored by all supported browsers.', $error_level = 16384 ).../functions.php:5925
230.36484274000trigger_error( $message = 'Function WP_Dependencies-&gt;add_data() was called with an argument that is <strong>deprecated</strong> since version 6.9.0! IE conditional comments are ignored by all supported browsers.', $error_level = 16384 ).../functions.php:6131

Spring Boot Admin的介绍及使用

Spring Boot 有一个非常好用的监控和管理的源软件,这个软件就是 Spring Boot Admin。该软件能够将 Actuator 中的信息进行界面化的展示,也可以监控所有 Spring Boot 应用的健康状况,提供实时警报功能。

主要的功能点有:

  • 显示应用程序的监控状态
  • 应用程序上下线监控
  • 查看 JVM,线程信息
  • 可视化的查看日志以及下载日志文件
  • 动态切换日志级别
  • Http 请求信息跟踪
  • 其他功能点……

可点击 https://github.com/codecentric/spring-boot-admin 更多了解 Spring-boot-admin。

创建Spring Boot Admin项目

创建一个 Spring Boot 项目,用于展示各个服务中的监控信息,加上 Spring Boot Admin 的依赖,具体代码如下所示。

<dependency>
<groupId>org.springframework.boot</groupId>
<artifactId>spring-boot-starter-web</artifactId>
</dependency>
<dependency>
<groupId>de.codecentric</groupId>
<artifactId>spring-boot-admin-starter-server</artifactId>
<version>2.0.2</version>
</dependency>

创建一个启动类,具体代码如下所示。

  1. @EnableAdminServer
  2. @SpringBootApplication
  3. public class App {
  4. public static void main(String[] args) {
  5. SpringApplication.run(App.class, args);
  6. }
  7. }

在属性文件中增加端口配置信息:

server.port=9091

启动程序,访问 Web 地址 http://localhost:9091 就可以看到主页面了,这个时候是没有数据的,如图 1 所示。

Spring Boot Admin主页
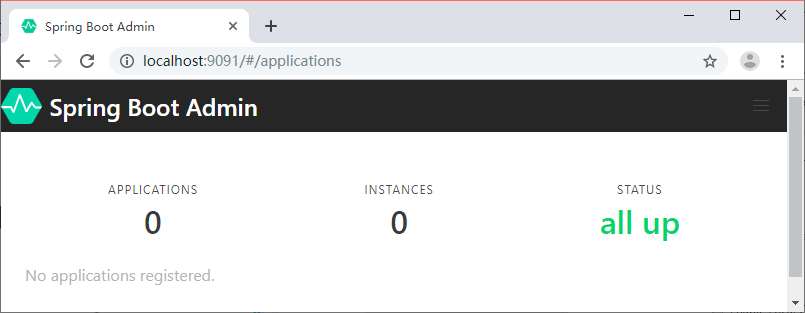
图 1  Spring Boot Admin主页

将服务注册到 Spring Boot Admin

创建一个 Spring Boot 项目,名称为 spring-boot-admin-client。添加 Spring Boot Admin Client 的 Maven 依赖,代码如下所示。

<dependency>
<groupId>de.codecentric</groupId>
<artifactId>spring-boot-admin-starter-client</artifactId>
<version>2.0.2</version>
</dependency>

然后在属性文件中添加下面的配置:

server.port=9092
spring.boot.admin.client.url=http://localhost:9091

spring.boot.admin.client.url:Spring Boot Admin 服务端地址。

将服务注册到 Admin 之后我们就可以在 Admin 的 Web 页面中看到我们注册的服务信息了,如图 2 所示。

Spring Boot Admin主页(有数据)
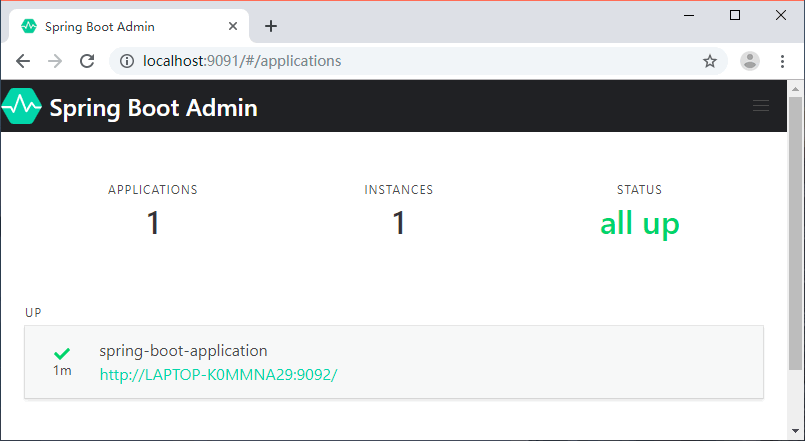
图 2  Spring Boot Admin主页(有数据)

点击实例信息跳转到详细页面,可以查看更多的信息,如图 3 所示。

Spring Boot Admin详情
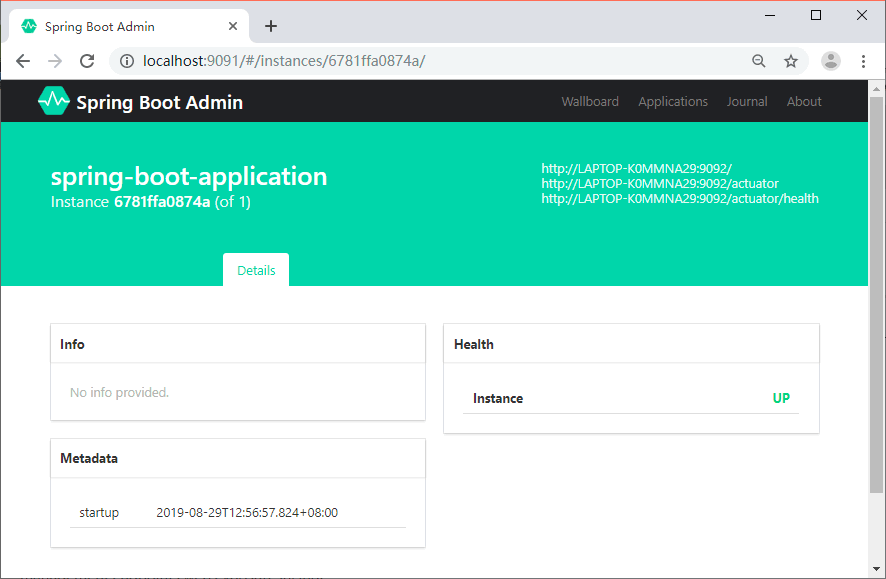
图 3  Spring Boot Admin详情

可以看到详情页面并没有展示丰富的监控数据,这是因为没有将 spring-boot-admin-client 的端点数据暴露出来。

在 spring-boot-admin-client 中加入 actuator 的 Maven 依赖,代码如下所示。

<dependency>
<groupId>org.springframework.boot</groupId>
<artifactId>spring-boot-starter-actuator</artifactId>
</dependency>

然后在属性文件中追加下面的配置:

management.endpoints.web.exposure.include=*

management.endpoints.web.exposure.include:暴露所有的 actuator 端点信息重启 spring-boot-admin-client,我们就可以在详情页面看到更多的数据,如图 4 所示。

Spring Boot Admin详情(有数据)
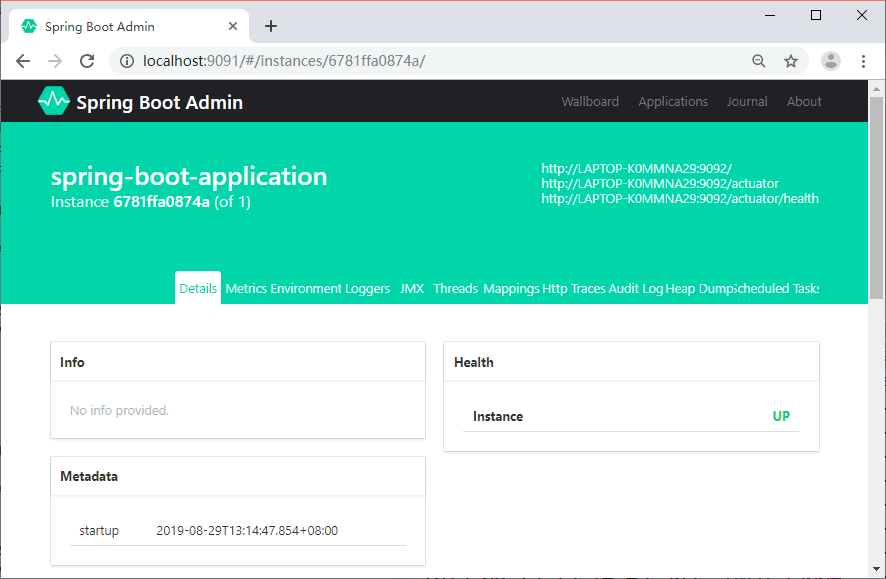
图 4  Spring Boot Admin详情(有数据)

监控内容介绍

自定义的 Info 信息、健康状态、元数据,如图 5 所示。

Spring Boot Admin数据展示(一)
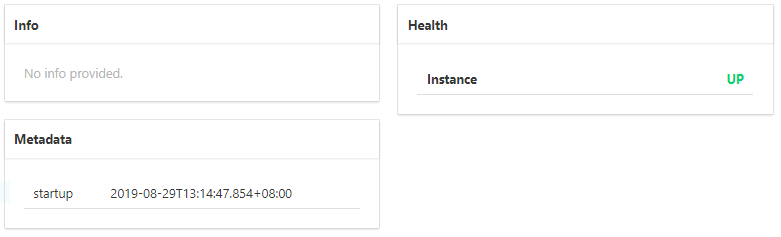
图 5  Spring Boot Admin数据展示(一)

CPU、线程等信息如图 6 所示。

Spring Boot Admin数据展示(二)
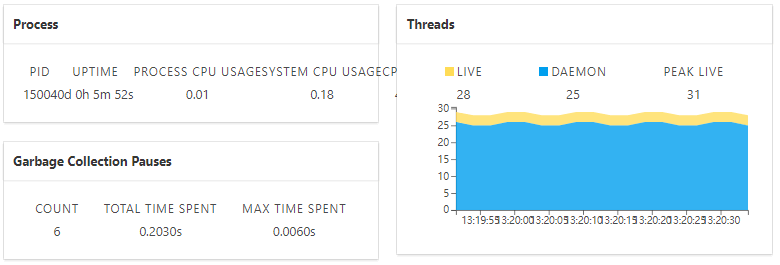
图 6  Spring Boot Admin数据展示(二)

内存使用情况如图 7 所示。

Spring Boot Admin数据展示(三)
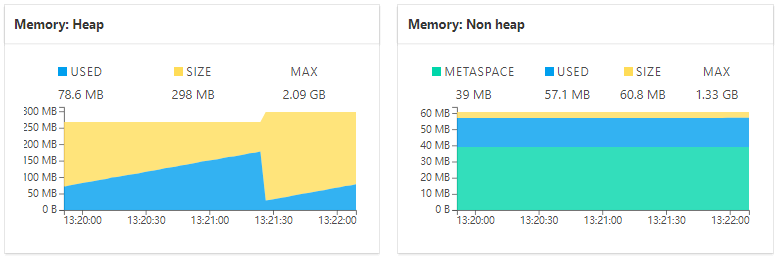
图 7  Spring Boot Admin数据展示(三)

配置信息如图 8 所示。

Spring Boot Admin数据展示(四)
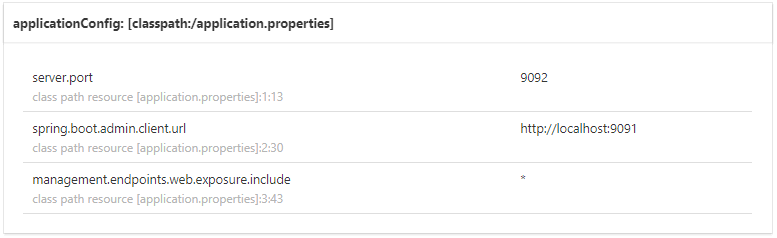
图 8  Spring Boot Admin数据展示(四)

日志级别调整如图 9 所示。

Spring Boot Admin数据展示(五)
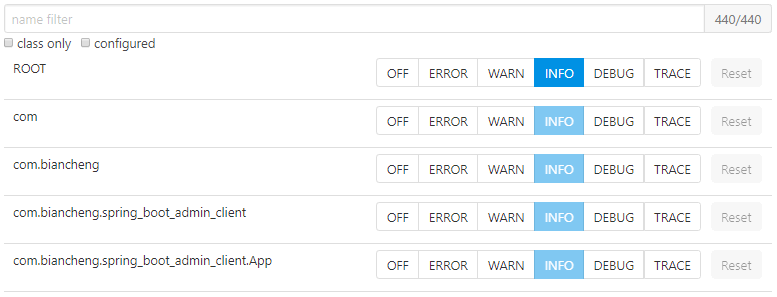
图 9  Spring Boot Admin数据展示(五)

Http请求信息如图 10 所示。

Spring Boot Admin数据展示(六)
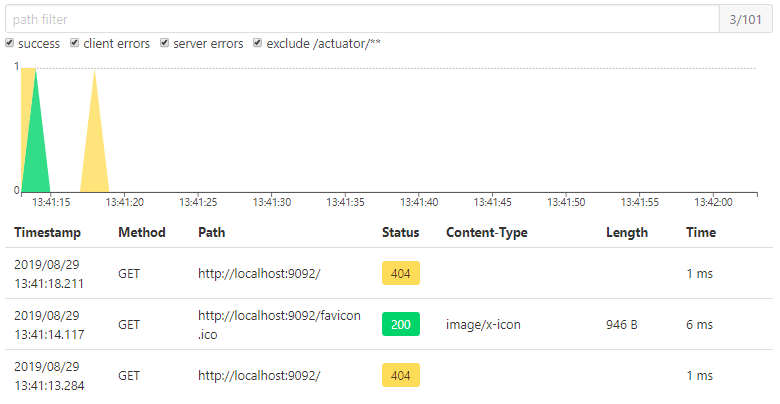
图 10  Spring Boot Admin数据展示(六)

如何在Admin中查看各个服务的日志

Spring Boot Admin 提供了基于 Web 页面的方式实时查看服务输出的本地日志,前提是服务中配置了 logging.file。

我们在 spring-boot-admin-client 的属性文件中增加下面的内容:

logging.file=/Users/zhangsan/Downloads/spring-boot-admin-client.log

重启服务,就可以在 Admin Server 的 Web 页面中看到新加了一个 Logfile 菜单,如图 11 所示。

Spring Boot Admin日志
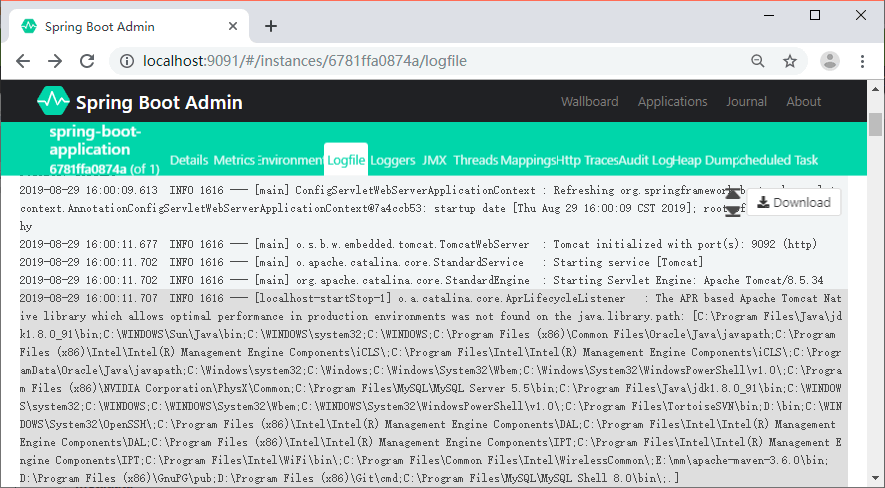
图 11  Spring Boot Admin 日志

Leave a Reply

Your email address will not be published. Required fields are marked *

This site uses Akismet to reduce spam. Learn how your comment data is processed.